Singdata Lakehouse MCP Server User Case
End-to-End Natural Language Conversational Approach from Data Acquisition to Visual Analytics
Case Overview
This case demonstrates how to use Claude Desktop with Singdata Lakehouse MCP Server to complete an end-to-end data science workflow from data acquisition, storage, and analysis to visualization through natural language conversation.
Case Scenario: Analyze New York City Green Taxi 2025 operational data and build a business insights dashboard
Technologies Involved:
- Claude Desktop (AI assistant interface)
- Singdata Lakehouse (cloud-native data lakehouse)
- MCP Server (Model Context Protocol service)
- NYC TLC public dataset
Solution Highlights
Zero-Code Data Analysis
- Describe requirements in natural language, and AI automatically executes all complex data operations
- No need to write SQL, Python, or any other code
- Automatically handles data download, cleaning, storage, and analysis
Enterprise-Grade Data Infrastructure
- Cloud-native Lakehouse architecture supporting petabyte-scale data processing
- Automatic backup and version management
- High availability and security guarantees
Intelligent Data Insights
- AI-driven data analysis and pattern discovery
- Automatically generates business insights and recommendations
- Interactive visualization dashboard
Implementation Steps
Step 1: Environment Preparation
Step 2: Data Acquisition and Storage
User Input:
AI Execution Process:
-
Create Storage Space
- Automatically create external Volume:
nyc_green_taxi_data - Connect OSS storage:
oss://mcp-data-hangzhou/nyc-green-taxi/ - Configure auto-refresh and recursive scanning
- Automatically create external Volume:
-
Batch Data Download
- Intelligently identify NYC TLC official data source
- Download Jan-Jul 2025 Parquet files
- Automatically handle file format and compression
-
Data Ingestion
- Create unified data table:
nyc_green_taxi_2025 - Standardize data schema and field types
- Add data month identifier field
- Create unified data table:
Results Summary:
- Total records: 351,612 trips
- Time span: Jan-Jul 2025
- Data size: approx. 8.5 MB (Parquet compressed)
- Processing time: <5 minutes
Step 3: Intelligent Data Analysis
User Input:
AI Analysis Dimensions:
-
Time Trend Analysis
- Monthly trip volume and revenue changes
- 24-hour usage patterns
- Weekday vs. weekend comparison
-
Spatial Distribution Analysis
- Identify popular pickup locations
- Discover high-value areas
- Trip distance statistics
-
Business Metrics Analysis
- Fare distribution and structure
- Payment method preferences
- Congestion fee impact assessment
-
User Behavior Analysis
Key Findings
Revenue Trends
- Peak month: May revenue of $1.33 million, up 31.6% month-over-month
- Average fare: $24.45, showing an upward trend
- Total revenue: $8.6 million accumulated over 7 months
Time Patterns
- Peak hours: 4-6 PM, over 25,000 trips per hour
- Nighttime premium: Average fare of $30+ from 2-4 AM
- Weekend effect: Weekend fares are 3.9% higher than weekdays
Geographic Distribution
- Popular areas: Locations 74 and 75 contribute 38.7% of total trip volume
- High-value points: Location 244 averages $35.47 per fare
- Coverage: Primarily serves outer boroughs and Upper Manhattan
Payment Trends
- Digital adoption rate: 74% use credit card payments
- Cash share: 26%, showing a declining trend
- Congestion fee: 9.6% of trips include it, averaging $0.75
Visualization Dashboard
Interface Features
- Responsive design: Adapts to desktop, tablet, and mobile
- Interactive charts: Supports zoom, filter, and drill-down
- Real-time data: Configurable auto-refresh
- Modern UI: Gradient backgrounds, animated effects
Chart Types
- 📈 Trend charts: Dual-axis display of monthly revenue and trip volume
- 📊 Bar charts: 24-hour usage patterns, popular location rankings
- 🍩 Donut charts: Fare distribution, payment method breakdown
- 📋 Metric cards: Key KPIs at a glance
Business Value
🚀 Efficiency Gains
- Development time: Reduced from weeks to minutes
- Technical barrier: Zero code, business users can directly use it
- Iteration speed: Rapid response to changing requirements
Insight Quality
- Multi-dimensional analysis: Full coverage of time, space, and user behavior
- Intelligent discovery: AI identifies patterns easily overlooked by humans
- Decision support: Direct business recommendations and predictions
Cost Optimization
- Infrastructure: Cloud-native architecture, pay-as-you-go
- Human resources: Reduced dependency on specialized data teams
- Maintenance cost: Automated operations, lower management overhead
Applicable Scenarios
📊 Business Analytics
- Sales data analysis and forecasting
- Customer behavior insights
- Market trend research
- Competitive analysis
Operations Optimization
- Supply chain efficiency analysis
- Equipment maintenance prediction
- Quality control monitoring
- Cost structure optimization
Product Analytics
- User retention analysis
- Feature usage statistics
- A/B test evaluation
- Product roadmap planning
Marketing Analytics
- Advertising effectiveness evaluation
- Channel ROI analysis
- User profiling
- Precision marketing strategies
Core Tools Deep Dive
1. Claude Desktop
Role: Intelligent conversational interface and AI assistant
Core Capabilities:
- 🤖 Natural language understanding: Converts user requirements into specific operational commands
- 🔄 Multi-modal interaction: Supports text, charts, code, and other output formats
- 🧠 Intelligent reasoning: Performs logical reasoning and decision-making based on context
- 📋 Task orchestration: Automatically plans and executes complex data workflows
Application in this case:
- Understands natural language commands such as "create a volume" and "download data"
- Automatically plans the complete workflow from data acquisition to visualization
- Intelligently analyzes data patterns and generates business insights
- Creates interactive HTML dashboards
2. MCP Server (Model-Context Protocol)
Role: Bridge between AI and external systems
Core Capabilities:
- 🔌 Protocol translation: Converts AI commands into database operations
- 🛡️ Security proxy: Provides secure data access control
- ⚡ Efficient communication: Optimizes interaction performance between AI and data systems
- 🔧 Tool integration: Supports 70+ specialized data operation tools
Key MCP Tools:
📊 Data Management Tools
🏗️ Table Structure and Volume Tools
🔍 Query and Analysis Tools
🌐 Data Acquisition Tools
🔗 Connection Management Tools
3. Singdata Lakehouse
Role: Cloud-native data lakehouse integrated platform
Core Architecture:
- 🏗️ Storage-compute separation: Independent scaling, cost optimization
- 📊 Multi-mode support: Batch processing, stream processing, interactive queries
- ⚡ Query acceleration: Intelligent caching and pre-computation
Data Storage Layer:
- Volume management: Unified data storage abstraction
- Multi-cloud support: OSS, S3, COS, and other object storage
- Format compatibility: Parquet, ORC, JSON, CSV, and more
- Version control: Data lineage and time travel
Compute Engine:
- SQL engine: Standard SQL, compatible with multiple dialects
- Vector computing: Supports AI/ML workloads
- Stream processing: Real-time data pipelines
- Federated queries: Unified queries across data sources
Application in this case:
- Created
nyc_green_taxi_datavolume for storing raw data - Established
nyc_green_taxi_2025table for structured storage - Executed complex multi-dimensional analysis queries
- Supported sub-second query response for 350,000+ records
4. External Data Sources
NYC TLC (Taxi & Limousine Commission)
Data Characteristics:
- 📅 Regular updates: Monthly releases, 2-month latency
- 📊 Data quality: Officially authoritative, standardized format
- 💾 Storage format: Parquet compressed format
- 🌐 Access method: CDN accelerated download
Data Fields (21 core fields):
5. Visualization Component (Claude Desktop Artifacts)
Chart.js + Custom HTML
Chart Types:
- 📈 Dual-axis line charts: Monthly trends (trip volume + revenue)
- 📊 Bar charts: 24-hour patterns, popular locations
- 🍩 Donut charts: Fare distribution, payment methods
- 📋 Metric cards: Key KPI display
Interactive Features:
- ✨ Hover effects: Display detailed values
- 🔄 Responsive: Adapts to different screen sizes
- 🎨 Animations: Smooth transition effects
- 📱 Mobile-friendly: Touch optimized
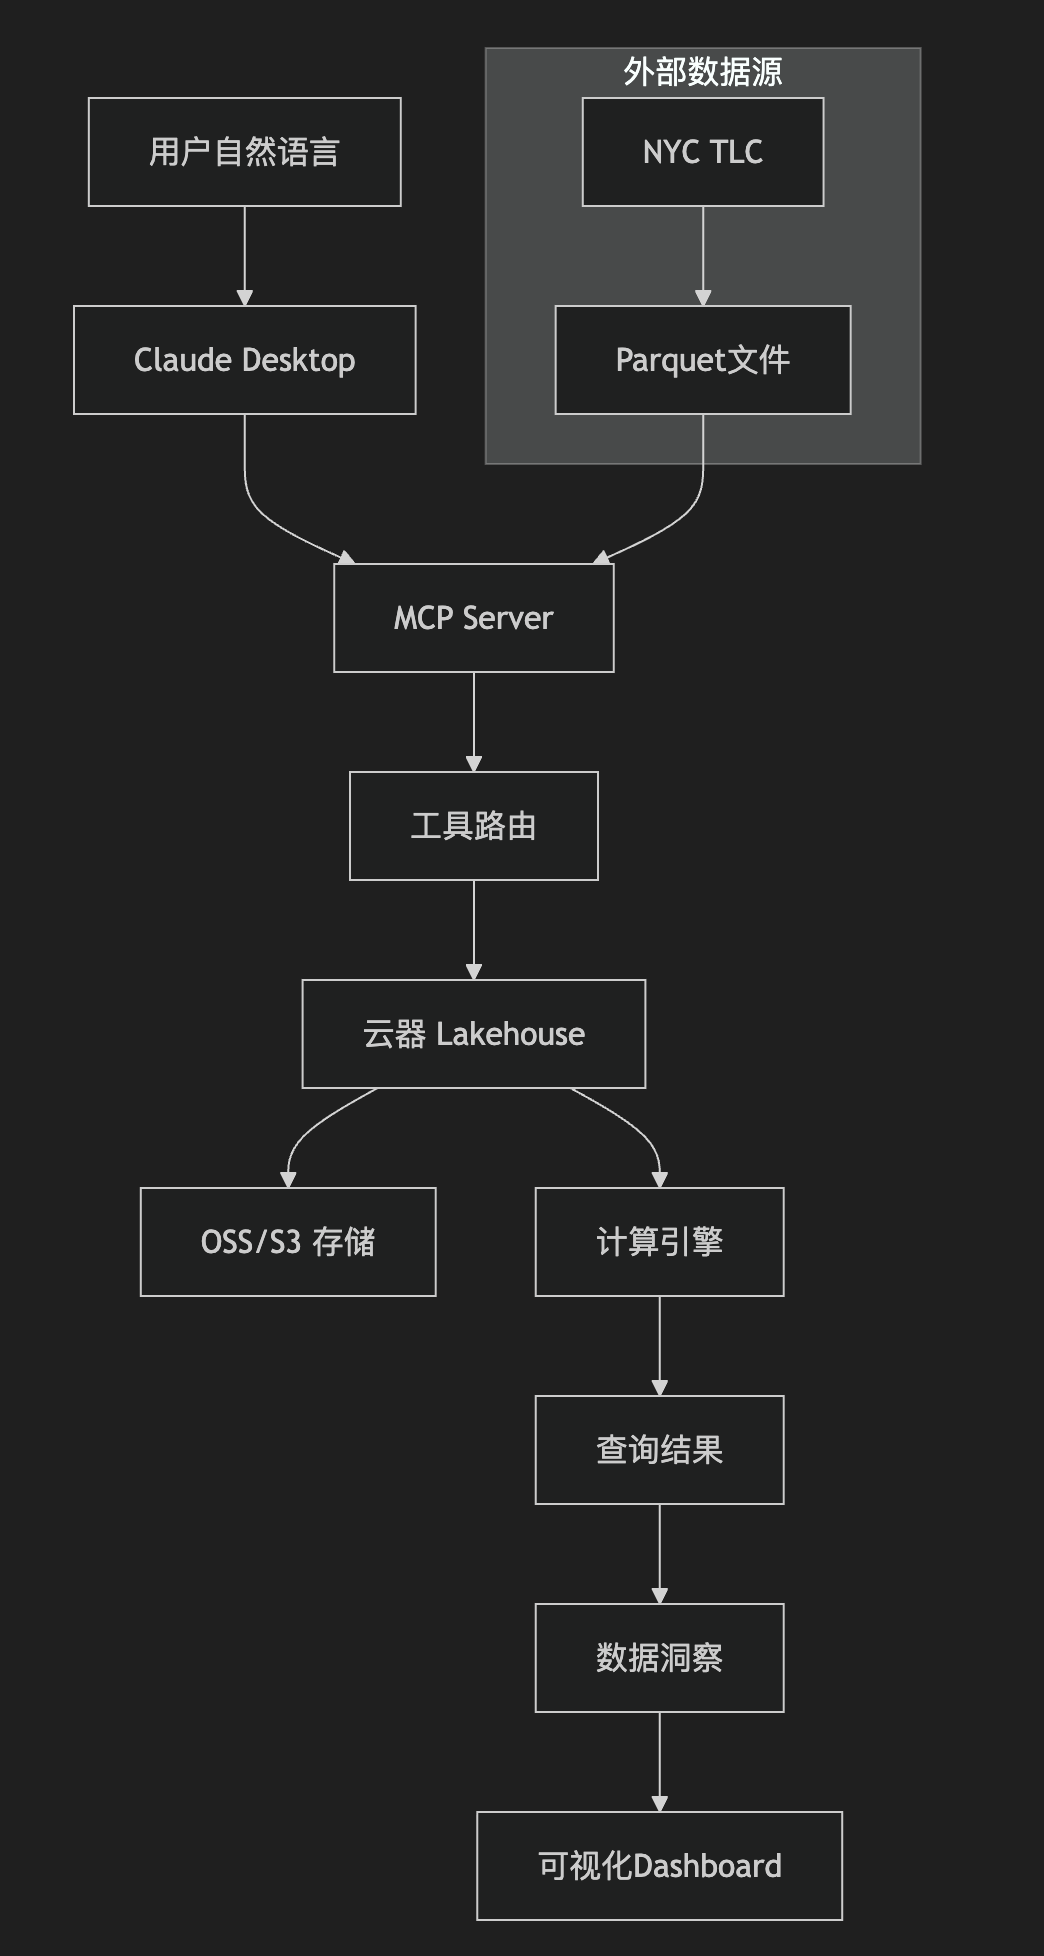
Technical Architecture
Data Flow Architecture
Tool Call Examples
Actual tool call sequence in this case:
Performance Optimization Features
- Query cache: Millisecond-level response for repeated queries
- Intelligent indexing: Automatic index creation for frequently queried fields
- Partitioning strategy: Monthly partitioning to improve query efficiency
- Compressed storage: Parquet format saves 90% storage space
- Parallel processing: Concurrent multi-file download and processing
Quick Start
1. Apply for Trial
- Visit the Singdata official website to apply for an account
- Download and install the Claude Desktop client
- Configure the MCP Server connection
2. Prepare Data
- Define analysis goals and data sources
- Prepare data access permissions
- Plan storage structure
3. Start the Conversation
4. Obtain Insights
- Review automatically generated analysis reports
- Engage in conversational deep dives with AI
- Export results and visualizations
Summary
Singdata Lakehouse MCP Server, combined with Claude Desktop, provides enterprises with an unprecedented data analysis experience:
Core Advantages
- Natural interaction: Complete complex data analysis through conversation
- Zero technical barrier: Business users directly obtain insights
- Enterprise-grade capability: Supports large-scale, high-concurrency scenarios
- Rapid iteration: From idea to insight in minutes
Innovative Breakthroughs
- Redefining human-machine collaboration models
- Dramatically lowering the barrier to data analysis
- Accelerating enterprise digital transformation
- Unlocking the true value of data
Future Outlook
As AI technology continues to advance, this "conversational data analysis" approach will become an enterprise standard, enabling every business user to become a data analyst and letting data truly drive every business decision.
Start your intelligent data analysis journey today!