
Aligning Historical Order Patterns with Marketing, Supply Chain, and Sales Operations
Align historical order patterns with marketing, supply chain, and sales to boost forecast accuracy, streamline operations, and improve business performance.

Successful businesses use historical order patterns to enhance performance across departments. A multinational retailer analyzed vast sales data to predict demand before hurricanes, enabling smarter inventory stocking. Predictive analytics lets organizations adjust inventory and refine marketing based on past sales spikes and external factors. Data-driven strategies help companies define clear goals, analyze trends, and continuously improve operations. These practices give companies a competitive advantage, improving efficiency and responsiveness in dynamic markets.
Key Takeaways
Looking at old order patterns shows how sales changed before.
This helps companies guess what people will buy and plan well.
Sharing data and goals with all teams helps everyone work together.
It also helps teams make better choices.
Keeping all data in one spot saves time and stops mistakes.
It also helps people make smart choices faster.
New tools like computers and data help find patterns.
These tools help companies guess sales more correctly.
Teams should check data often and work together.
This helps them react fast to changes and helps the business grow.
Understanding Historical Order Patterns

Defining Historical Order Patterns
Historical order patterns describe the trends and behaviors found in past sales and order data. Businesses track these patterns using time series data, which records information in chronological order. This data can include metrics collected at regular intervals, such as daily sales or monthly revenue. Companies also analyze events that occur irregularly, like product launches or special promotions.
Key metrics help define these patterns:
Customer Lifetime Value (CLV)
Product adoption rate
Customer Acquisition Cost (CAC)
Net Promoter Score (NPS)
Customer Satisfaction (CSAT) score
Patterns often reveal recurring events, such as seasonal spikes during holidays or sudden changes caused by external events. Businesses also look for anomalies and outliers, which can signal unusual demand or operational issues. By identifying these elements, organizations gain a clearer picture of their sales cycles and customer behavior.
Relevance to Business Forecasting and Planning
Understanding historical order patterns plays a vital role in business forecasting and planning. Predictive analytics and statistical models, such as regression and ARIMA, extract meaningful trends from past data. For example, Amazon uses historical sales data and external factors like weather to predict demand, which helps prevent overstocking or stockouts. This approach leads to significant financial benefits and operational efficiency.
Recent studies show that advanced forecasting techniques, including machine learning and time series analysis, improve forecast accuracy. ChampionX, a chemical manufacturer, reduced forecast errors by 20% by leveraging historical sales data and advanced models. These improvements support better production planning and inventory management.
Businesses continuously compare forecasted results with actual outcomes to refine their models. Metrics like mean absolute percentage error help measure accuracy. By maintaining data integrity and automating forecasting processes, companies can make real-time adjustments. This proactive approach ensures forecasts remain relevant, even in changing markets.
Impact on Marketing, Supply Chain, and Sales Operations

Marketing Applications of Historical Order Patterns
Marketing teams use historical order patterns to improve campaign targeting and resource allocation. By analyzing past sales data, marketers can identify trends and predict when customers are most likely to buy. For example, a winter apparel store combined sales history with weather data to choose the best times for advertising. This approach led to better ad spending and improved stock management, which increased return on investment. Hubspot used visitor behavior data to retarget users who abandoned signups, addressing their concerns in ads and boosting conversion rates. DirectTV personalized homepage content for people who recently moved, outperforming standard offers. These strategies show how marketers use order data to reach the right audience and maximize results.
Supply Chain Optimization Using Order Data
Supply chain managers rely on historical order data to forecast demand, manage inventory, and streamline operations. Companies like Procter & Gamble, Amazon, and General Electric have achieved significant improvements by analyzing order trends:
Company | Supply Chain Success Metric(s) | Numerical Data / Impact |
|---|---|---|
Procter & Gamble | Reduction in supply chain touchpoints | |
Amazon | Reduction in unplanned equipment downtime and cost savings | 69% reduction; ~$37.83 million saved |
General Electric | Reduction in waste, complaints, and increase in throughput | 75% less waste; 38% fewer complaints; 5%-20% throughput increase |
These results highlight how data-driven forecasting and inventory planning lead to cost savings, higher efficiency, and better service levels.
Enhancing Sales Operations and Demand Planning
Sales operations benefit from sharing historical sales data and collaborating with production teams. When teams work together, they create more accurate demand forecasts and reduce disruptions. Collaborative demand planning uses both expertise and data to optimize inventory and shorten lead times. Integrated business planning connects sales, marketing, finance, and operations, using historical data to create unified forecasts. Advanced analytics and AI tools help sales teams respond quickly to market changes, improving customer satisfaction and agility. Companies that align sales and production with historical order insights see better resource allocation and operational efficiency.
Strategies for Aligning Historical Order Patterns
Data Integration and Centralization
Organizations achieve better results when they bring all their data together. Centralizing data gives teams a complete view of business activities. This approach helps leaders make faster and smarter decisions. Companies that centralize data see big improvements. For example, 78% of companies use data centralization in their customer data strategy. These companies report a 64% increase in efficiency and a 57% boost in business growth.
Evidence Aspect | Details |
|---|---|
Statistical Findings | 78% of companies use data centralization in customer data strategy; 64% efficiency improvement; 57% business growth increase |
Strategic Decision-Making | Centralized data provides a holistic view enabling actionable insights and informed decisions |
Improved Data Accessibility | Eliminates need to navigate disparate systems, enabling quick access to relevant data |
Enhanced Analysis & Reporting | Centralized data supports advanced analytics like predictive modeling and easier KPI reporting |
Improved Data Quality | Central data governance ensures consistency and quality across the organization |
Simplified Business Processes | Eliminates silos and redundancies, improving workflows and operational efficiency |
Streamlined Data Management | Single location simplifies backups, updates, maintenance, and security implementation |
Centralized data also improves security and trust. Companies can control access and keep information safe. Data stays accurate and consistent, which helps teams avoid mistakes. When all departments use the same data, they work together more smoothly. This approach supports better analysis, reporting, and compliance.
Real-time insights from centralized data help companies respond quickly to new opportunities or threats. Teams can deliver a seamless customer experience by connecting data across all touchpoints.
Cross-Functional Collaboration
Teams from marketing, sales, supply chain, and IT must work together to align strategies. Cross-functional collaboration breaks down barriers between departments. When teams share information, they create more accurate forecasts and plans. For example, a SaaS startup improved revenue projections by combining marketing data on leads with sales conversion rates. A consumer goods company matched sales data with promotional calendars and production schedules, which helped predict demand more accurately. A food distributor used predictive analytics on demand patterns and delivery schedules to reduce excess stock.
Collaboration also helps teams set shared goals. They use target metrics and key performance indicators (KPIs) to measure progress. These KPIs reflect the company’s main objectives and prevent departments from working at cross purposes. Teams often use the SMART method to set these goals. SMART stands for Specific, Measurable, Achievable, Relevant, and Time-Bound. This method makes goals clear and easy to track.
Metric Category | |
|---|---|
IT Metrics | Cost savings from process efficiency, reduction in obsolete systems, IT total cost of ownership (TCO) |
Customer Metrics | Average customer wait time, labor cost per call, calls handled per agent per hour |
Business/Strategy Metrics | Operational efficiency, cost reductions, customer satisfaction, alignment with strategic goals |
Compliance Metrics | Metrics ensuring adherence to regulatory and internal standards |
Teams that work together and use shared KPIs improve forecasting, reduce waste, and increase customer satisfaction.
Technology and Analytics Adoption
Modern technology and analytics tools help companies get the most from historical order patterns. Advanced analytics allow teams to find trends and make better predictions. Many organizations now use both structured and unstructured data. They analyze sales, customer feedback, and even social media posts. By 2025, experts predict that 70% of organizations will use new analytics methods to improve decision-making.
Metric / Technology | Description / Impact |
|---|---|
Labor Cost Reduction | 5-15% decrease in labor costs due to improved pattern recognition in scheduling. |
Schedule Accuracy | Better alignment of staffing levels with actual needs. |
Employee Satisfaction | Higher satisfaction scores and lower turnover. |
Scheduling Efficiency | Less time spent on creating and adjusting schedules. |
Business Performance | Higher productivity and customer satisfaction. |
Machine Learning Algorithms | Identify and refine patterns in historical data. |
Predictive Analytics | Forecast future needs and spot potential problems. |
Analyze large amounts of business data to find complex patterns. | |
Cloud Computing | Real-time, scalable pattern analysis across locations and time periods. |
Companies that use advanced analytics see real results. Walmart improved inventory turnover by 25% and reduced out-of-stock incidents by 40%. Amazon cut order processing time in half and kept accuracy at 99.9%. Automated trading firms improved efficiency by 50% and reduced errors by 65%. These improvements show the power of technology in aligning business operations.
Companies that adopt analytics and technology gain a competitive edge. They make better decisions, save money, and improve customer service.
Establishing Shared KPIs
Shared Key Performance Indicators (KPIs) help teams move in the same direction. When marketing, sales, and supply chain teams use the same KPIs, they can measure progress together. This approach builds trust and improves results. Each department often tracks its own metrics. Shared KPIs create a common language for success.
Why Shared KPIs Matter
Teams that use shared KPIs see better alignment. They avoid working at cross purposes. For example, if marketing wants to boost sales but supply chain cannot deliver enough products, the company loses opportunities. Shared KPIs help everyone focus on the same goals.
Tip: Shared KPIs encourage teamwork. They help teams solve problems faster and celebrate wins together.
Examples of Shared KPIs
Companies choose KPIs that reflect their main business goals. These KPIs must be clear, easy to measure, and relevant to all teams. Here are some examples:
KPI Name | Description | Department(s) Involved |
|---|---|---|
Forecast Accuracy | Measures how close forecasts are to actual sales | Sales, Supply Chain |
Inventory Turnover | Tracks how often inventory sells and replaces | Supply Chain, Sales |
On-Time Delivery Rate | Shows the percentage of orders delivered on time | Supply Chain, Sales |
Campaign ROI | Calculates return on marketing investments | Marketing, Sales |
Customer Satisfaction | Measures how happy customers feel | All |
Order Fulfillment Time | Tracks how long it takes to complete an order | Supply Chain, Sales |
These KPIs help teams see the big picture. They show how actions in one area affect results in another.
Steps to Establish Shared KPIs
Identify Business Goals
Leaders start by setting clear business goals. These goals guide the choice of KPIs.Select Relevant KPIs
Teams pick KPIs that match the goals. Each KPI must matter to more than one department.Define Measurement Methods
Teams agree on how to measure each KPI. This step ensures everyone uses the same data and methods.Set Targets Together
Teams set targets for each KPI. These targets must be realistic and challenging.Review and Adjust Regularly
Teams meet often to review progress. They adjust KPIs and targets as needed.
Best Practices for Shared KPIs
Use simple language for KPI names and definitions.
Make data sources transparent.
Update KPIs as business needs change.
Celebrate when teams reach shared targets.
Use dashboards to track KPIs in real time.
Note: Shared KPIs work best when leaders support them. Leaders must show why these KPIs matter and reward teams for working together.
Shared KPIs drive better decisions. They help teams act quickly and stay focused on what matters most. When everyone measures success the same way, the company grows stronger.
Overcoming Alignment Challenges
Addressing Data Silos
Many organizations struggle with data silos. These silos create barriers between departments and systems. Teams often store information in separate databases, which leads to several problems:
Compromised data integrity causes errors such as mismatched inventory and flawed financial reports.
Siloed data blocks business visibility, making accurate analysis and decision-making difficult.
Manual data synchronization wastes time and resources, leading to operational inefficiencies.
Customers experience inconsistent service when data does not match across channels, which damages trust.
Retailers often see fragmented customer insights because online and in-store sales data remain separate.
Manufacturers face delays and higher costs when inventory and production data are not connected.
Siloed data prevents unified customer views, making it hard to track sales and marketing efforts or spot cross-sell opportunities.
A LinkedIn survey found that 60% of respondents believe misalignment between Sales and Marketing hurts financial performance. HubSpot reports that 99% of marketers value personalized campaigns, which require integrated data. Overcoming data silos improves efficiency, customer experience, and business outcomes.
Ensuring Data Quality and Consistency
Reliable data forms the backbone of effective business operations. Companies use several methods to maintain high data quality and consistency:
Implement data quality frameworks to standardize handling.
Conduct regular audits to detect inaccuracies.
Use automated validation checks for data correctness.
Train staff on best practices.
Set up feedback channels for reporting issues.
Verify sources for reliability.
Employ data cleansing tools to fix errors.
Document processes for consistency.
Assign a data governance team for oversight.
Reduce manual entry to limit mistakes.
Plan for backup and recovery.
Address inconsistencies quickly.
Use reconciliation to ensure alignment.
Key data quality dimensions include timeliness, completeness, accuracy, validity, consistency, uniqueness, and integrity. Tools like Monte Carlo, Databand, and Great Expectations help monitor and validate data. Setting KPIs, such as the percentage of validated records, helps track progress and ensures that integrated data remains trustworthy.
Managing Organizational Change
Change management plays a vital role in aligning business operations. Success depends on several factors, as shown in the chart below:
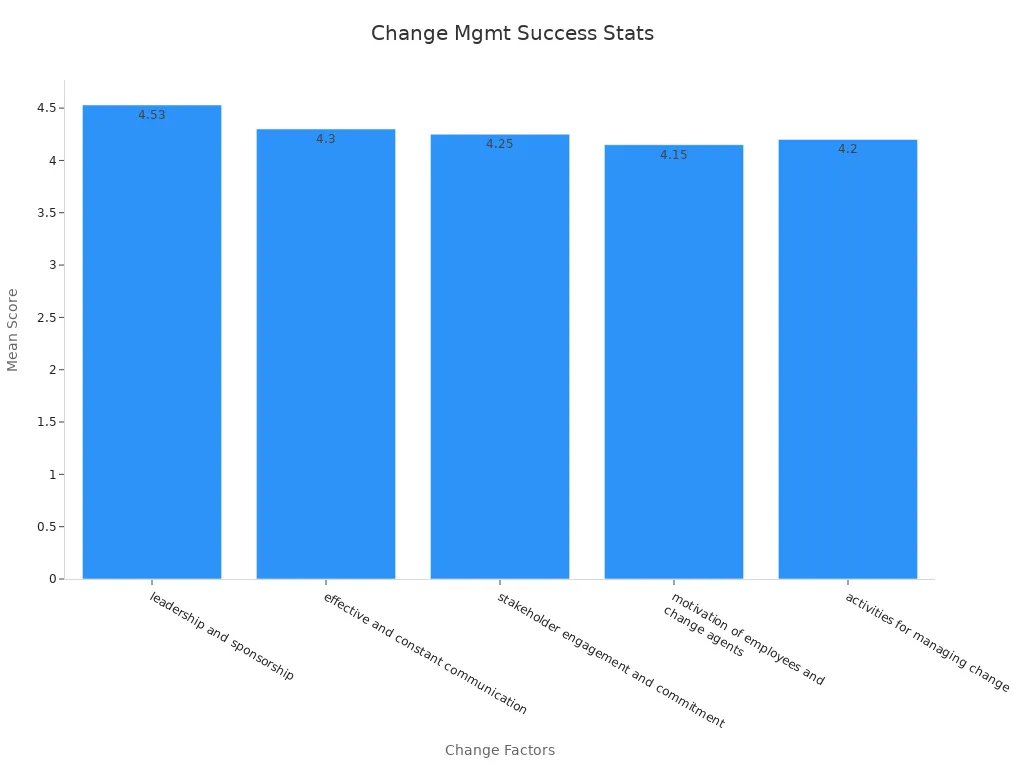
Strong leadership and sponsorship set a clear vision. Effective communication keeps everyone informed. Stakeholder engagement ensures commitment and resource availability. Motivated employees and structured change activities drive progress. Organizations that use data analytics and AI in change management gain predictive insights, measure performance, and optimize processes. These steps help reduce resistance and increase agility, supporting successful alignment of business operations.
Real-World Success Stories
Retailer Boosts Forecast Accuracy with Historical Order Patterns
Retailers have achieved remarkable improvements by using past order data to guide their decisions. Walmart stands out as a leader in this area. The company uses historical sales data to manage inventory more effectively. This approach reduces stockouts and excess inventory. Walmart also shares sales data with suppliers, which helps everyone in the supply chain respond faster to changes in demand. Amazon uses similar strategies. By analyzing customer data, Amazon offers personalized recommendations and adjusts prices based on demand trends. These actions increase sales and improve customer satisfaction.
Advanced forecasting methods, such as machine learning and AI, have reduced forecasting errors by up to 50%. This leads to better inventory planning and cost savings. The following table highlights key results from several retailers:
Metric / Case | Description | Impact / Result |
|---|---|---|
Better alignment of supply and demand | 3%+ boost in pre-tax profit | |
Improved production efficiency and steadier supply | Fewer disruptions | |
Retailers lose 4% of sales from stockouts | $40M lost per $1B in sales annually | |
AI-based forecasting reduces product unavailability | Higher service levels and more sales captured | |
$9 Million Annual Savings | Improved demand forecasting avoids overproduction | Direct cost savings |
Retailers who improve forecast accuracy see higher profits, fewer stockouts, and better customer experiences.
Manufacturer Reduces Inventory Issues through Alignment
Manufacturers also benefit from aligning operations with accurate order data. Many use statistical models and machine learning to analyze sales trends. This helps them predict demand more precisely. As a result, they avoid both stockouts and overstocking. Manufacturers who use these methods optimize inventory levels and reduce costs.
Manufacturers use sales data and market trends to improve forecasting.
Better forecasting prevents inventory shortages and excess stock.
Machine learning models help predict demand more accurately.
Data-driven alignment leads to lower inventory costs and fewer disruptions.
These improvements create a more stable supply chain. Production runs more smoothly, and companies spend less on emergency shipments or storage. Manufacturers who align their planning with accurate data gain a clear advantage in efficiency and cost control.
Actionable Steps for Implementation
Assess Current Data and Processes
Organizations begin by evaluating their current data and operational workflows. They check if data meets business rules, such as valid product codes or age ranges. Teams look for duplicate records, which can distort analysis. Data quality processes include setting standards, cleaning records, and ongoing monitoring. These steps help maintain trustworthy data for decision-making.
Key metrics guide this assessment:
Metric Name | Description | Example Summary |
|---|---|---|
Delivery Time | Time from order to delivery | Sets customer expectations |
On-time Delivery Rate | Orders delivered on or before promised date | |
Order Accuracy | Orders without errors | 91.3% order accuracy |
Inventory Accuracy | Match between records and physical stock | 91% inventory accuracy |
Lead Conversion Rate | Leads that become deals | 69.5% conversion rate |
Customer Churn Rate | Customers lost in a period | Measures attrition |
Teams also monitor data volume, freshness, completeness, and latency. These metrics help detect problems early and ensure timely, accurate data for operations.
Tip: Regular audits and automated validation tools help keep data reliable and up to date.
Build a Cross-Functional Team
A strong cross-functional team brings together experts from sales, marketing, supply chain, and IT. These teams use both task-oriented and relational communication to work well together. Relational communication, such as supportive statements, helps reduce conflict and builds trust. Task-oriented responses keep the team focused on goals.
Research shows that cross-functional teams need to balance decision-making with teamwork. They must overcome silos and blend different skills. Teams that manage communication well perform better and avoid mistakes. Specialized teams handle complex tasks, like integrating order data, more effectively.
Teams that use positive communication patterns see higher cooperation.
Relational statements followed by task responses improve operational results.
Avoiding negative communication keeps teams productive.
Note: Regular team meetings and clear roles help maintain focus and build strong working relationships.
Select and Deploy the Right Technology
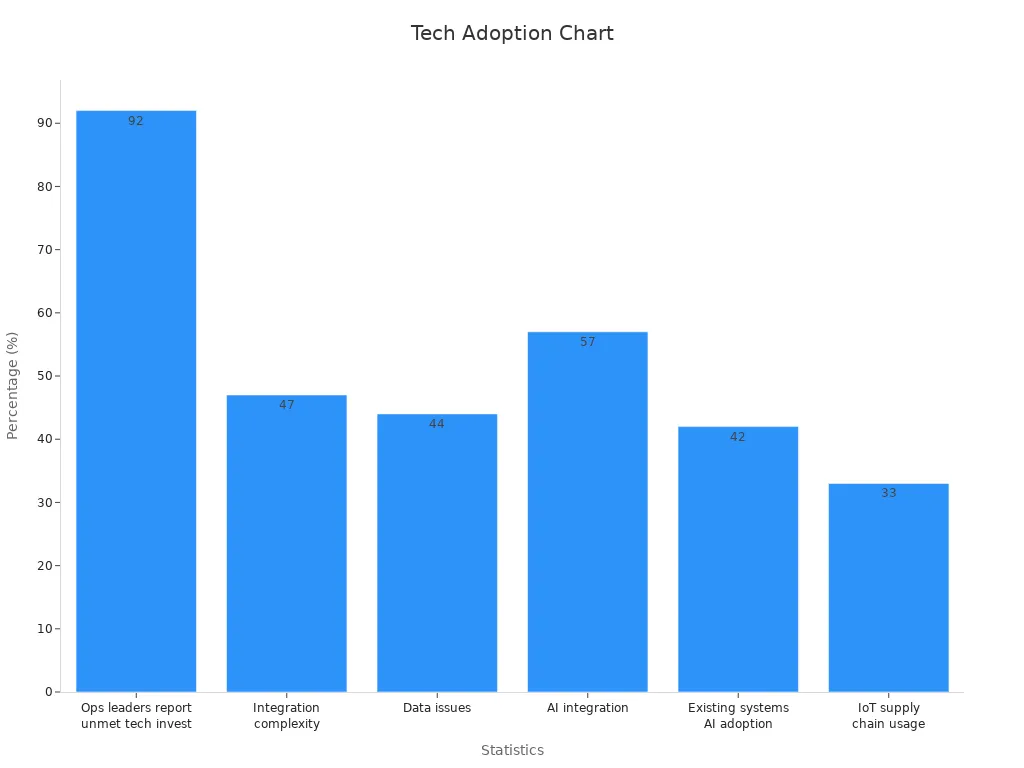
Choosing the right technology is critical for successful data integration. Many operations leaders report unmet expectations from tech investments. Integration complexity and data issues often cause these problems. Teams must select tools that fit current systems and support high data quality.
Statistic / Insight | Percentage / Detail | Relevance to Data Integration |
|---|---|---|
Leaders reporting unmet tech expectations | 92% | Highlights need for careful selection |
Integration complexity as a barrier | 47% | Shows importance of integration capability |
Data issues as a barrier | 44% | Emphasizes need for data quality |
AI in operations | 57% | Supports advanced data processing |
Integration with existing systems as a challenge | 42% | Reinforces integration complexity |
IoT-enabled supply chain usage | 33% | High value for those who adopt |
Teams should look for solutions that offer easy integration, strong data governance, and support for AI or IoT if needed. Regular reviews and feedback help ensure the technology meets business needs.
Tip: Start with a pilot project to test new technology before a full rollout.
Monitor, Measure, and Refine Alignment
Successful organizations do not stop after aligning their teams and processes. They monitor, measure, and refine alignment to maintain high performance. Leaders track key operational performance indicators (OPIs) to spot trends and address issues quickly. These OPIs help teams understand where to improve and how to keep operations running smoothly.
Operational Performance Indicator | Role in Monitoring and Refining Alignment |
|---|---|
Cycle Time | Measures duration of processes, helping identify bottlenecks and improve speed |
Throughput | Assesses production rate, ensuring capacity meets demand |
Resource Utilization | Evaluates efficient use of assets and workforce |
Overall Equipment Effectiveness (OEE) | Measures manufacturing efficiency by combining availability, performance, and quality |
Teams use these indicators to make data-driven decisions. They set flexible targets that adapt to market shifts or supply chain disruptions. By eliminating redundant metrics, teams avoid data overload and focus on what matters most. Metrics should reflect seasonal patterns to capture demand changes.
Continuous review of these metrics improves accuracy and catches data issues early. This approach enables teams to solve problems before they grow.
Modern organizations use real-time data collection, customizable dashboards, and automated reporting tools. These tools support ongoing monitoring and quick adjustments. Regular reviews foster a culture of continuous improvement and keep employees engaged. When departments align their metrics with company goals, they break down silos and work together more effectively.
Set flexible targets for changing conditions.
Remove unnecessary metrics to stay focused.
Adapt measures to reflect seasonal trends.
Review data often to catch errors early.
Use real-time dashboards for quick insights.
Encourage teams to act on findings and share results.
A commitment to monitoring and refining alignment ensures that companies stay agile and competitive. Teams that measure their progress and adjust their strategies can respond faster to new challenges and opportunities.
Aligning historical order patterns with marketing, supply chain, and sales operations drives measurable gains in forecasting, efficiency, and teamwork. Companies that connect these areas see improved forecast accuracy, higher inventory turnover, and better order fulfillment. Leadership support and shared goals help teams adapt quickly to market changes. Regular cross-team check-ins and unified data break down barriers. These strategies enable organizations to achieve long-term growth, stronger customer satisfaction, and higher profit margins.
FAQ
What are historical order patterns?
Historical order patterns show trends in past sales and customer orders. Companies use these patterns to predict future demand. Teams can spot seasonal changes, sales spikes, and unusual events. This information helps businesses plan better and avoid mistakes.
How do shared KPIs improve cross-functional alignment?
Shared KPIs give teams common goals. Marketing, sales, and supply chain teams track the same results. This approach builds trust and teamwork. Teams can measure progress together and solve problems faster.
Why is data centralization important for business operations?
Data centralization puts all information in one place. Teams can access accurate data quickly. This method reduces errors and saves time. Leaders make better decisions with a complete view of business activities.
What challenges do companies face when aligning order data?
Companies often face data silos, poor data quality, and resistance to change. Teams may use different systems or methods. These issues slow down progress and cause mistakes. Strong leadership and clear communication help solve these problems.
Which technologies help analyze historical order patterns?
Advanced analytics, machine learning, and cloud computing help teams find trends in order data. These tools process large amounts of information. Companies use them to predict demand, improve inventory, and boost customer satisfaction.
See Also
Effective Weekly Methods To Forecast Retail Demand Accurately
Top Four Algorithms For Scaling Daily Inventory Replenishment
Key Basket Analysis Methods Every Retail Data Team Needs
Creating Data-Based Stage-Gate Processes For Retail Launches
Practical Insights On Forecasting Consumption Trends In Retail