
Data Center Infrastructure and Services: A Complete Enterprise Guide
A practical enterprise guide to data center infrastructure and services: facility layers, colocation vs on-premises placement, Tier certification limits, AI rack density, RTO/RPO contracting, vendor claim verification, and an acceptance checklist.
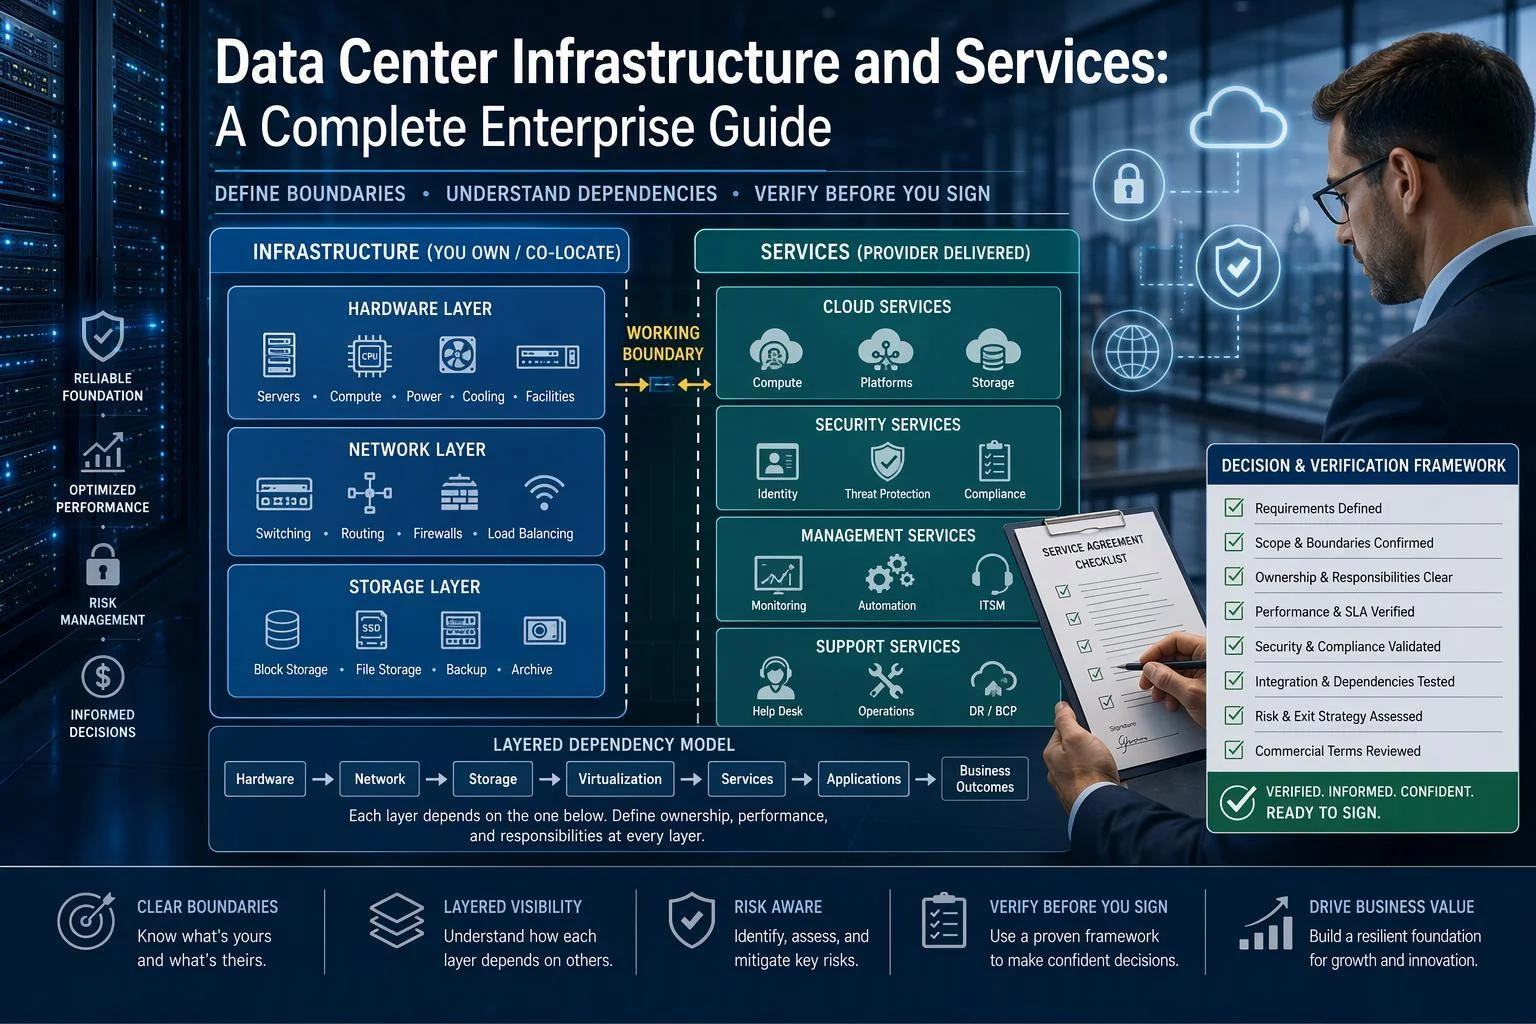
Data center infrastructure and the services sold around it are usually discussed in the same breath, which is why procurement conversations drift. A colocation quote, a Tier III certificate, a PUE figure and an uptime SLA describe four different things, measured at four different boundaries, and none of them is a warranty on your workloads.
This guide separates the two categories, then builds the dependency chain that connects a facility's power and cooling capacity to the latency your analytics users actually experience. From there it moves to decisions: where to place each workload, what a certification does and does not cover, how AI density changes the physical requirements, how to set recovery targets you can test, and how to verify vendor claims in your own environment. It closes with an acceptance checklist and answers to the questions buyers ask most often.
Standards and survey material referenced here reflect editions available as of November 2026. Tier definitions, ASHRAE thermal envelopes and NIST guidance are revised periodically; confirm the current edition before writing a specific figure into a contract.
What Counts as Data Center Infrastructure and What Counts as a Service
The practical dividing line is what you own versus what someone operates on your behalf, and where the responsibility boundary sits when something fails. Infrastructure is the physical and logical capacity a facility provides: space, power distribution and backup, cooling, cabling, physical security and the network fabric. Services are the activities performed on top of that capacity: monitoring, staffing, maintenance, connectivity, and managed or cloud-delivered platforms.
The distinction matters because the two carry different failure modes, different contract language and different evidence. An infrastructure defect shows up as a power or cooling event. A service defect shows up as an unstaffed shift, a missed change notification or a maintenance window nobody scheduled around your peak.
The US Department of Energy's data center design guide draws the line in operational terms: colocation facilities "provide rental of space, power, and cooling to customers along with network service to connect customer owned and managed IT systems," and it notes the advantages are largest against small on-premises sites that "may lack around-the-clock expert staff, adequate redundancy, and efficient design." That is a useful framing because it names the bundle rather than pretending colocation is one category or the other.
A classification test for any offering
Apply four questions in order. First, what is the physical asset, and who holds title to it? Second, who performs the recurring operational work, and are they your staff or the provider's? Third, at which boundary is the commitment measured, and what is excluded from that boundary? Fourth, if the commitment is missed, what is the remedy — a service credit, an engineering escalation, or nothing contractual?
Colocation usually answers as infrastructure-plus-service: you own the servers, the provider owns the hall, the power path and the cooling, and the SLA typically covers environmental parameters rather than your application. Managed hosting shifts more of the operational layer to the provider. Consumption models such as infrastructure-as-a-service move the capital decision to an operating one without changing the underlying physics; the racks still draw the same kilowatts.
A gray zone worth naming explicitly is interconnection. Cross-connects and meet-me-room access are services in contract terms and infrastructure in dependency terms — lose them and your multi-provider architecture stops being multi-provider. Ask for the interconnection policy and the cross-connect lead time as part of the infrastructure review, not the commercial one.
How the Facility, Network, Compute, and Data Platform Layers Depend on Each Other
Each layer above inherits the constraints of the layer below, and the inheritance is not symmetric: a constraint propagates upward almost immediately, while a fix propagates downward slowly and expensively. That asymmetry is the reason capacity planning fails when it starts at the workload.
Start at the facility. Available power and cooling set a ceiling on how much heat a hall can remove, and the ceiling is expressed per rack as much as in total. A hall designed for 8 kW racks cannot host a 60 kW rack by adding servers; the power distribution, the cooling distribution and often the floor structure all have to change. Density, not total square metres, is the binding constraint in most existing sites.
Density then constrains the cooling and power distribution design. Higher heat per rack forces a choice between more airflow, containment, in-row or rear-door heat exchangers, or liquid cooling to the chip. Each choice changes the facility's water and power overhead, which is why PUE and water use move together when density rises.
Network topology constrains where compute can sit. Tightly coupled workloads — distributed training, large shuffles, high-concurrency joins — are sensitive to round-trip latency and to bandwidth per accelerator. If two halves of a job sit in different halls or different regions, the interconnect becomes part of the compute budget. Placement decisions that look like real-estate decisions are often network decisions.
The data platform inherits everything beneath it. Its availability ceiling is the availability of the power path, the cooling, the network and the storage it depends on; its latency floor is set by the slowest hop between compute and data. A query engine cannot deliver sub-second response if the data it reads crosses a congested link or waits on a storage tier that is itself throttled.
Failure propagation follows the same path in reverse. A utility event degrades the power path, which forces load shedding, which drops compute nodes, which triggers query retries, which amplifies load on the surviving nodes. Retry storms are the classic example of a facility-layer event becoming a platform-layer outage. Design the platform to fail in bounded steps: cap retries, isolate tenants, and make degraded mode an explicit state rather than an emergent one.
On-Premises, Colocation, Hyperscale, or Hybrid: A Placement Decision Framework
There is no universally correct placement, and any guide that names one is describing its own constraints. What you can do is score each workload against the criteria that actually discriminate between options, then let the scores force the conversation your organisation needs to have.
Six criteria do most of the work. Control and sovereignty: which data and processing must remain under a specific legal or organisational jurisdiction, and who must be able to prove it. Latency sensitivity: what round-trip time the workload needs, and whether that is achievable across a wide-area link. Density and power availability: whether the site can deliver the kilowatts per rack the workload requires, and whether utility interconnection timelines fit the schedule. Staffing depth: whether you can sustain 24×7 operations with the skills the equipment demands. Cost structure: capital versus operating, and how each interacts with your depreciation and budget cycles. Exit paths: what it costs in time and money to leave, and how much of your data and configuration you can take with you.
Score each workload from one to five on each criterion, weight the criteria by business impact, and compare totals. The value is less in the number than in the disagreements it surfaces: a finance owner and a platform owner rarely weight exit cost the same way, and that gap is the real decision.
The DOE guide is careful here, and worth quoting for its restraint: organisations may choose on-premises only, a "cloud first" strategy, or "a hybrid solution where extremely critical data operations are conducted in an on-premises data center but other operations, such as data storage, are cloud provided," and determining what is best for a specific organisation is outside its scope. Treat hybrid the same way — as a deliberate architecture with its own data-movement, identity and governance costs, not as the safe default when a decision is hard.
Uptime Institute's 2026 survey adds a market signal worth noting: for the first time, third-party data center facilities and services account for a larger share of IT workloads than enterprise-owned data centers, measured by facility rather than total capacity. That describes where workloads are running across a sample; it does not tell you where yours belong.
What a Tier or Certification Actually Guarantees
A Tier certificate is evidence about a facility's topology and, separately, its operations. It is not a prediction that your service will stay up, and reading it as one is the most common certification error in procurement.
Uptime Institute defines four design levels, each incorporating the requirements of the ones below it: Tier I (Basic Capacity), Tier II (Redundant Capacity), Tier III (Concurrently Maintainable) and Tier IV (Fault Tolerant). The names describe resulting characteristics. Concurrent maintainability means every piece of critical equipment can be taken out of service for planned maintenance without shutting down the IT load; fault tolerance means the site can survive an unplanned failure of a critical component without impact.
Two limits follow directly from the originals. First, the Tier definitions "define criteria, but not specific technology options or design choices to meet the Tier," so two certified sites can be built from entirely different equipment. Second, Uptime states that its topology and operational sustainability standards do not cover building codes, regional weather, security or property usage, because those vary case by case.
Certification also has phases, and the phase matters. Certification of Design Documents applies to a document package and is provisional; Uptime gave design certifications issued after 1 January 2014 a two-year expiry precisely because it has not verified the constructed environment. Certification of Constructed Facility verifies what was built. Certification of Operational Sustainability assesses the plans and operating parameters — the phase most often skipped and the one that addresses the human side of downtime.
Certification is not permanent either. Uptime states that certifications can be revoked if unreviewed changes compromise a facility's concurrent maintainability or fault tolerance. Ask for the current certificate, its scope and its date, and ask what change-control process protects it.
TIA-942 is a separate standard with its own rated levels, and its certification programme is distinct from Uptime's Tier system. Do not treat the two as interchangeable or assume a Rated-3 site and a Tier III site are equivalent without reading both scopes. Whichever scheme applies, the certificate answers a design and operations question. It does not test your workloads, your failover logic or your recovery procedures — those are yours to prove.
How AI and Analytics Workloads Change Power, Cooling, and Network Requirements
AI and analytics change the physical requirements because they change density, and density is the variable that most facility designs were not built around. The direction of the shift is well established; the specific numbers are claims to validate against your own configuration.
ASHRAE's guidance on AI data center energy and thermal efficiency puts the contrast plainly: GPU clusters drive rack-level power densities "often 40–100 kW per rack vs. 5–10 kW in legacy CPU racks." That is a range across deployments, not a specification for any one cluster, and it is the single most consequential input to a facility fit assessment.
Survey data shows the installed base moving more slowly than the leading edge. Uptime Institute's 2026 survey reports that the average of modal rack densities surpassed 11 kW for the first time, up from 9 kW the prior year, with a small number of new high-density facilities above 30 kW pulling the average up; excluding those, the average modal density sits at 7.8 kW. Both facts are true at once, and the gap between them is where most enterprise planning goes wrong: the fleet average describes the industry, not your next GPU cluster.
Cooling follows density. ASHRAE's 2021 thermal guidelines define recommended and allowable envelopes for air-cooled equipment — for Classes A1–A4, a recommended dry-bulb range of 18°C to 27°C, with allowable ranges extending from 15–32°C for A1 to 5–45°C for A4 — and a separate table for high-density servers, where the H1 recommended range is 18–22°C. Operating inside the recommended envelope is the conservative choice; operating in the allowable range is permitted but shifts thermal management to the equipment. Above the air-cooled envelope, direct-to-chip liquid cooling becomes the practical path, and it changes the facility's water and heat-rejection design.
Network requirements change with the workload shape. Tightly coupled training and large analytical joins are sensitive to latency and to bandwidth per accelerator, so fabric design becomes a first-order constraint on where the job can run. LBNL's 2025 update to the United States Data Center Energy Usage Report finds that in 2030, as AI servers dominate energy consumption, networking maintains a roughly constant share of energy use, reflecting the substantial networking requirements of AI facilities.
Vendor-reported efficiency and performance figures belong in the validation plan, not the business case. Treat them as claims with a stated methodology, and test them under your own workload mix before you commit capacity.
Setting and Proving RTO and RPO Before You Sign
Recovery targets are business decisions that get written into contracts, and the order matters: derive them from impact first, then negotiate. A target inherited from a vendor's standard tier is a number nobody has tested against the business.
NIST SP 800-34 Rev. 1 supplies the definitions. Maximum Tolerable Downtime (MTD) is the threshold beyond which the loss of a system becomes unacceptable to the supported mission or business process. Recovery Time Objective (RTO) "defines the maximum amount of time that a system resource can remain unavailable before there is an unacceptable impact on other system resources, supported mission/business processes, and the MTD." Recovery Point Objective (RPO) sets the acceptable data loss measured in time. NIST also notes that when it is not feasible to meet the RTO immediately and the MTD is inflexible, a Plan of Action and Milestones should document the gap and the mitigation plan — a useful precedent for honest contracting.
Derive targets from a business impact analysis. For each system, ask what happens at one hour, four hours, one day and three days of unavailability: which revenue stops, which regulatory clock starts, which manual workaround begins and what it costs. The shortest interval at which the impact becomes unacceptable is your MTD; RTO must sit inside it with margin for detection and decision time.
Then make the targets testable in the contract. NIST lists the elements to negotiate for contingency arrangements, and they translate directly into clauses: site availability and priority access; the number of other clients subscribing to the same resources; the change and modification process; termination conditions and extension process; change management and notification requirements including hardware, software and infrastructure; security requirements; staff support provided or not provided; testing, including scheduling, availability and duration; and service-level management with defined performance measures. NIST also warns that multiple organisations may contract for the same alternate site, so the vendor's priority policy should be negotiated rather than assumed.
Prove the targets with functional exercises, not tabletops alone. NIST describes functional exercises as simulated operational environments in which staff perform their duties and exercise specific procedures and assets, from validating one aspect of a plan to full-scale exercises covering all elements. Schedule them, define success criteria in advance, and record the actual recovery time. An untested RTO is an intention.
How to Test Vendor Performance and Uptime Claims in Your Own Environment
Verification splits cleanly into what you can establish before signature and what only post-deployment testing can settle. Confusing the two is how buyers end up accepting a claim they never had a chance to check.
Self-reported industry average PUE from Uptime Institute's annual survey series, annualized basis. Uptime notes that PUE is best suited to tracking a single site over time or observing directional motion in large samples, not comparing a few differing facilities, because resiliency objectives, climate and design choices all move the number. Some plotted year labels were partially garbled in source extraction; the 2025–2026 pair (1.52, from 1.54) is the reliable comparison and is described by Uptime as a seven-year trend of relative stasis. Do not compare these values with a facility reporting a different measurement category (UPS output, PDU output or IT equipment input) or a different averaging period.
Before the contract, you can examine methodology and run bounded pilots. For uptime claims, ask what counts as an outage, at which boundary it is measured, and whether planned maintenance is excluded. For PUE, the measurement boundary is decisive: the Green Grid's PUE guidance defines measurement levels from basic to advanced and explicitly discourages comparing different data centers without proper research and analysis, while the ENERGY STAR task force distinguishes PUE categories by whether IT energy is measured at the UPS output, the PDU output or the IT equipment input. Two facilities reporting "1.3" may be measuring different numerators. Ask for the category, the averaging period and the data collection frequency.
For performance claims, ask for the benchmark configuration, dataset scale, concurrency and the version of the engine tested. A throughput number without those conditions is not comparable to your workload. Where a vendor publishes results, read the methodology before the headline.
After deployment, the tests that matter are the ones your architecture will actually face. Run failover drills that exercise the real path — utility loss, UPS transfer, generator start, cooling failure — and time the recovery against the RTO you wrote down. Run load tests at your expected peak and at the retry-amplified load a partial failure produces. Run sustained density trials: hold the rack at its design power for long enough that thermal steady state is reached, not just the first ten minutes.
Match the measurement boundary to the claim every time. If the SLA covers power availability at the PDU, a test at the application layer measures something else. If the PUE figure is annualised, a week of spot readings cannot confirm or refute it.
Finally, treat operational discipline as a testable property. Uptime's 2026 survey reports that 89% of respondents who experienced an impactful downtime incident say it could have been avoided with better management, processes or configuration, and its 2025 outage analysis found that 85% of human-error incidents stemmed from staff failing to follow procedures or from flawed procedures. Ask to see change-control records, drill schedules and the last exercise report. Those documents predict availability better than a redundancy diagram.
Acceptance Checklist and Further Reading
Use this list as a signing gate rather than a reading exercise. Each item should produce a document you can file, not a verbal assurance. Items marked with a section reference are explained in that part of the guide.
Boundary and scope
Every offering in the deal is classified as facility asset, operational service, or bundled product, with the classification written into the contract schedule (see What Counts as Data Center Infrastructure and What Counts as a Service).
The dependency chain from facility to data platform is documented, and each layer's availability assumption is stated explicitly rather than inherited by default (see How the Facility, Network, Compute, and Data Platform Layers Depend on Each Other).
The placement decision records the criteria that discriminated between options — control, latency, density, staffing, cost structure, exit path — and the weight given to each (see On-Premises, Colocation, Hyperscale, or Hybrid).
Certification and design
The Tier or TIA-942 award is identified by type: design documents, constructed facility, or operational sustainability. A design-only award is provisional and expires.
The award date is within the certification's validity period, and any topology change since the award has been submitted for review.
You have confirmed in writing that the standard does not cover security, building codes, or your own workloads.
Physical capacity
Contracted power and cooling are stated per rack or per zone at the density you actually intend to deploy, not at a facility average.
The cooling architecture is matched to your thermal profile, including whether liquid cooling is available and at what coolant temperature.
Network topology, cross-connect paths, and latency to your other dependencies are documented.
Recovery commitments
RTO and RPO are derived from a business impact analysis, not copied from a vendor default.
Both values appear in the contract with the measurement method, the test schedule, and the remedy for a missed target.
The contingency checklist from NIST SP 800-34 Rev. 1 is addressed item by item: site availability, priority access, other subscribers to the same resources, change notification, testing schedule and duration, and termination conditions.
At least one functional exercise has been run and its results reviewed before go-live.
Verification
Every performance figure you rely on arrives with a stated methodology, measurement boundary, and test conditions.
Pre-contract evidence — pilot results, audit reports, reference calls, PUE measurement category — is on file.
Post-deployment tests are scheduled: failover drills, sustained load tests, and density trials at your target rack power.
Further reading
For the originals behind the claims in this guide, go to the sources directly rather than to summaries:
Uptime Institute Tier classification and the explanation of the Tier system, plus the institute's note on common misconceptions.
ASHRAE 2021 Thermal Guidelines reference card and ASHRAE's AI data center energy and thermal efficiency material.
DOE Best Practices Guide for Energy-Efficient Data Center Design.
The Green Grid's examination of the PUE metric and the ENERGY STAR metrics task force recommendations.
NIST SP 800-34 Rev. 1.
Uptime Institute Global Data Center Survey 2026 and the 2025 outage analysis.
LBNL's 2025 update to the United States Data Center Energy Usage Report.
Refresh note: This guide reflects standards and survey material available as of its publication date. Tier definitions, ASHRAE thermal envelopes, and NIST guidance are revised periodically; confirm the current edition before relying on a specific figure in a contract.
Frequently Asked Questions
Is colocation infrastructure or a service?
Both, and the contract should say so. The DOE guide describes colocation as rental of space, power, and cooling to customers, together with network service connecting customer-owned and customer-managed IT systems. The physical plant is infrastructure; the delivery, monitoring, and interconnection are services. Classify each obligation separately so that a failure in one is not absorbed by the other.
Does a Tier III certification mean the site will not go down?
No. Tier III is defined by concurrent maintainability — the ability to service and replace critical components without shutting down the IT load — not by an uptime guarantee. Uptime Institute states that its standards do not cover building codes, regional weather, security, or property usage, and that certification of design documents is provisional until the constructed facility is verified. Certification is an input to your due diligence, not a warranty against outage.
How do I compare PUE figures between two facilities?
Only after matching the measurement boundary and averaging period. PUE is total facility energy divided by IT equipment energy, and the result changes with where IT energy is metered — UPS output, PDU output, or IT equipment input — and over what period it is averaged. The Green Grid discourages comparing different data centers without proper research and analysis, and Uptime Institute notes that PUE is best suited to tracking a single site over time. Ask for the measurement category, the averaging period, and whether the figure is design or operational.
What evidence should I request before accepting an uptime SLA?
Ask for the outage definition, the measurement window, the exclusions, and the remedy calculation. A published colocation SLA shows the shape of this: service credits calculated as a fraction of the monthly rental charge, capped at a stated maximum per month. Then ask for the operational record behind the number — incident logs, failover test results, and the change-management process — because Uptime Institute's 2026 survey found that 89% of respondents who experienced impactful downtime said it could have been avoided with better management, processes, or configuration.
Do I need liquid cooling for AI workloads?
Not universally, but the decision now has to be made explicitly. ASHRAE describes GPU clusters at roughly 40–100 kW per rack against 5–10 kW in legacy CPU racks, and documents operators standardizing direct-to-chip liquid cooling for GPUs while retaining air cooling for storage and conventional compute. The right question is whether your target density and thermal profile fit the facility's cooling architecture — and whether the facility can support the density you plan to reach, not just the density you deploy on day one.