
From Data Swamps to Strategy: Making Merchandising Display Strategy Actionable in 30 Days
Transform data swamps into actionable merchandising strategies in 30 days. Learn how to clean, prioritize, and execute data-driven display plans effectively.

Disorganized data often creates barriers in merchandising. When you face "data swamps to strategy," it becomes difficult to extract meaningful insights, slowing decision-making and affecting performance. You can't afford to let this chaos linger. Transforming messy data into a clear strategy within 30 days is not just possible—it’s essential. This roadmap will guide you toward actionable solutions, helping you organize, strategize, and execute with confidence.
Key Takeaways
Turn messy data into useful ideas in 30 days to improve displays.
Find and focus on important data that boosts sales and happiness.
Make clear goals to guide your plan and check progress easily.
Use customer feedback to design displays that shoppers like and buy from.
Watch key numbers often to adjust your plan and stay successful.
Data Swamps to Strategy: Understanding the Problem
Defining Data Swamps in Merchandising
A data swamp occurs when your merchandising data becomes disorganized, overwhelming, and nearly impossible to use. Instead of clear insights, you face a chaotic mix of raw information from multiple sources. This often happens when data is collected without a clear plan or structure. For example, sales figures, customer preferences, and inventory levels might all exist in separate systems, making it hard to connect the dots. Without organization, this data remains untapped, leaving you unable to make informed decisions.
The Impact of Data Swamps on Business Performance
When your data is stuck in a swamp, it directly affects your business. Poorly managed data leads to missed opportunities. You might fail to identify which products resonate most with your customers or where to place high-demand items in your store. This lack of insight can result in lower sales, inefficient inventory management, and wasted resources. Worse, it can erode customer trust if outdated or incorrect data impacts their shopping experience. Transforming your data swamp into a strategy is critical to staying competitive.
Key Challenges in Making Data Actionable
Turning raw data into actionable insights comes with its own set of challenges. These obstacles often slow down your progress and make it harder to execute a merchandising strategy effectively. Below is a summary of the most common hurdles:
Challenge | Description |
|---|---|
Data Privacy Concerns | Issues related to protecting sensitive information during data processing. |
Difficulties in merging data from various sources effectively. | |
Rapid Pace of Technological Change | The need to keep up with fast-evolving technologies that impact data handling. |
Each of these challenges requires careful planning and the right tools to overcome. By addressing these issues, you can move from data swamps to strategy and unlock the full potential of your merchandising efforts.
Week 1: Organizing and Prioritizing Data
Cleaning and Structuring Data for Merchandising
The first step in transforming your data swamp into a strategy is cleaning and organizing your data. Start by identifying all the sources where your merchandising data resides. These could include sales reports, inventory systems, customer feedback, or even marketing analytics. Once identified, consolidate this data into a single, centralized system.
To clean your data, remove duplicates, outdated entries, and irrelevant information. For example, if you have sales data from five years ago that no longer reflects current trends, archive it. Use tools like data cleaning software or spreadsheets to streamline this process.
Structuring your data is equally important. Categorize it into logical groups, such as product categories, customer demographics, or seasonal trends. This structure makes it easier to analyze and extract insights. A well-organized dataset is the foundation for actionable merchandising strategies.
Tip: Automate data cleaning and structuring processes using tools like Python scripts or specialized software. This saves time and reduces errors.
Identifying High-Value Data Points
Not all data is created equal. Some data points hold more value for your merchandising strategy than others. Focus on identifying the metrics that directly impact your business goals. For instance, track which products generate the highest revenue, which items have the fastest turnover, and which customer segments drive the most sales.
To pinpoint high-value data, analyze patterns and trends. Look for correlations between customer behavior and product performance. For example, if a particular product sells well during specific seasons, prioritize that data for seasonal merchandising decisions.
Use real-time tracking tools to monitor these key metrics. Real-time data helps you stay agile and respond quickly to changes in customer preferences or market conditions. By focusing on high-value data, you can make informed decisions that drive results.
Note: High-value data often comes from a combination of internal metrics and external insights, such as customer surveys or market research.
Aligning Data with Business Objectives
Your data becomes truly actionable when it aligns with your business objectives. Start by defining clear goals for your merchandising strategy. These could include increasing sales, improving customer satisfaction, or optimizing inventory turnover. Once your goals are set, map your data to these objectives.
For example:
Use sales data to identify top-performing products and allocate prime display space to them.
Leverage customer insights to tailor your displays to specific demographics.
Cross-examine merchandising data with marketing research to uncover gaps and opportunities.
Collaboration between teams is crucial here. When merchandising and marketing teams work together, they can compare perspectives and validate assumptions. Real-time tracking and A/B testing further ensure that your decisions are based on reliable data.
Callout: Aligning your data with business objectives fosters collaboration and enhances decision-making. It bridges the gap between what customers want and what your business offers.
By the end of Week 1, you will have a clean, structured, and prioritized dataset that aligns with your goals. This sets the stage for developing a data-driven merchandising strategy in Week 2.
Week 2: Developing a Merchandising Strategy
Setting Clear Merchandising Goals
Clear goals are the backbone of any successful merchandising strategy. Without them, your efforts may lack direction and fail to deliver results. Start by defining specific, measurable objectives that align with your business priorities. For example, you might aim to increase sales of a particular product category by 15% within a month or improve customer satisfaction scores by 10%.
To understand the benefits of setting clear, data-based goals, consider the following:
Benefit | Description |
|---|---|
Optimizing product placement and shelf space can significantly boost sales. | |
Enhanced Customer Satisfaction | Tailoring the shopping experience to customer needs fosters loyalty and satisfaction. |
Competitive Advantage | Data-driven insights help you stand out by offering a better shopping experience than competitors. |
When you set goals, ensure they are realistic and achievable within your timeline. Use historical data and current trends to guide your expectations. For instance, if your data shows a spike in demand for seasonal items, focus on maximizing their visibility during that period.
Tip: Break down larger goals into smaller, actionable steps. This makes it easier to track progress and adjust your strategy as needed.
Leveraging Customer Insights for Strategy
Customer insights are a goldmine for crafting an effective merchandising strategy. By understanding your customers' preferences, behaviors, and pain points, you can create displays that resonate with them. Start by analyzing data from multiple sources, such as purchase history, online reviews, and in-store feedback.
Insights from customer behavior can guide decisions across channels. For example, if data shows that customers prefer eco-friendly products, you can highlight these items in your displays. Similarly, identifying trends like increased demand for specific colors or styles can help you prioritize merchandising initiatives.
Evidence Description |
|---|
Insights from customer behavior and preferences can guide cross-channel merchandising decisions. |
Identifying relevant trends helps prioritize merchandising initiatives effectively. |
Inventory insights can optimize product discovery strategies, especially for overstocked items. |
Trend analysis reveals emerging customer interests that inform future buying decisions. |
A merchandising strategy should balance the introduction of new items with the visibility of established products. |
Combining real-time behavioral data with traditional analytics enhances understanding of customer preferences. |
By leveraging these insights, you can create a strategy that not only meets customer expectations but also drives sales.
Callout: Customer insights are not static. Regularly update your data to stay aligned with changing preferences and market trends.
Prioritizing Product Displays Based on Data
Data-driven decisions take the guesswork out of merchandising. Use your cleaned and structured data to prioritize which products deserve prime display space. Focus on items with high sales potential, fast turnover rates, or strong customer demand.
Here are some key metrics to consider when prioritizing product displays:
Metric | Description |
|---|---|
Sales per square foot | Evaluates revenue generated per unit area of retail space, indicating effective product placement. |
Gross margin return on investment | Measures profit return on inventory cost, indicating profitable merchandising decisions. |
Inventory turnover rate | Assesses how frequently inventory is sold, indicating efficient inventory management. |
Sell-through rate | Calculates the percentage of inventory sold, evaluating merchandising effectiveness. |
Average transaction value (ATV) | Measures average spending per transaction, helping understand customer purchasing behavior. |
Conversion rate | Percentage of visitors making a purchase, crucial for assessing store layout and customer experience. |
Gross margin | Represents profitability as a percentage of sales, important for pricing strategies. |
Weeks of supply | Indicates how long current inventory will last, assisting in inventory planning. |
Customer retention rate | Measures percentage of repeat customers, indicating customer satisfaction and loyalty. |
Visual merchandising effectiveness | Assesses the impact of visual merchandising on sales and customer attraction. |
Real-world examples highlight the importance of prioritizing displays based on data. For instance:
The Safeboda case study demonstrates how data analysis can prioritize features based on user engagement and revenue potential.
A food delivery app used the RICE framework to evaluate tasks, ensuring decisions aligned with user needs and data insights.
These examples show how data can guide merchandising decisions, ensuring that your displays capture customer attention and drive sales.
Note: Regularly review your metrics to ensure your displays remain effective. Adjust your strategy as new data becomes available.
By the end of Week 2, you will have a well-defined merchandising strategy that leverages customer insights and prioritizes product displays based on data. This strategy will serve as the blueprint for implementation in Week 3.
Week 3: Implementing the Strategy
Applying Visual Merchandising Techniques
Visual merchandising transforms your store into a space that attracts and engages customers. Start by using proven techniques supported by performance data. For example, A/B testing helps you compare different display setups to identify what resonates most with shoppers. Heat mapping tools reveal high-traffic areas, allowing you to place key products where customers are most likely to see them.
Customer feedback also plays a vital role. Direct input from shoppers provides qualitative insights into what works and what doesn’t. Combine this with metrics like sales per square foot and conversion rates to measure the effectiveness of your displays.
Technique | Description |
|---|---|
Key Performance Indicators (KPIs) | Metrics like sales per square foot and conversion rates help assess merchandising effectiveness. |
A/B Testing | Comparing different displays provides insights into customer preferences. |
Customer Feedback | Direct feedback offers qualitative insights into visual merchandising success. |
Heat Mapping | Analyzing customer movement optimizes store layout and display placement. |
Tip: Use lighting, color schemes, and signage to draw attention to high-margin products. These small adjustments can significantly impact customer behavior.
Optimizing Store Layouts for Engagement
An optimized store layout encourages customers to explore and engage with your products. Retailers like Walmart and H&M have successfully used traffic flow analysis and heat mapping to improve product visibility and boost impulse purchases.
Retailer | Strategy | Impact |
|---|---|---|
Walmart | Traffic Flow Analysis | Improved product visibility and increased impulse purchases. |
H&M | Heat Mapping | Strategically placed promotional displays boosted sales. |
Target | Predictive Analytics for Layouts | Increased seasonal product sales and enhanced customer engagement. |
To replicate these successes, focus on creating intuitive pathways that guide customers through your store. Place high-demand items in easily accessible areas while using end caps for promotional products. Dynamic layouts, like those used by Zara, allow you to adapt quickly to changing trends and customer preferences.
Callout: A well-designed layout not only improves sales but also enhances the overall shopping experience, encouraging repeat visits.
Executing Data-Driven Display Strategies
Data-driven strategies ensure your displays align with customer needs and business goals. Retailers like Target and Amazon have demonstrated the power of analytics in optimizing product placements. For instance, Target used a pregnancy prediction model to adjust layouts and promotions, resulting in increased sales of baby-related products.
Retailer | Strategy | Outcome |
|---|---|---|
Target | Adjusted layouts and promotions for expectant mothers using analytics. | Increased sales of baby-related products by strategically placing them. |
Amazon | Personalized recommendations and product placements based on behavior. | Improved conversion rates through targeted positioning. |
Sephora | Analyzed app interactions to optimize product placements and promotions. | Enhanced customer satisfaction and sales of popular items. |
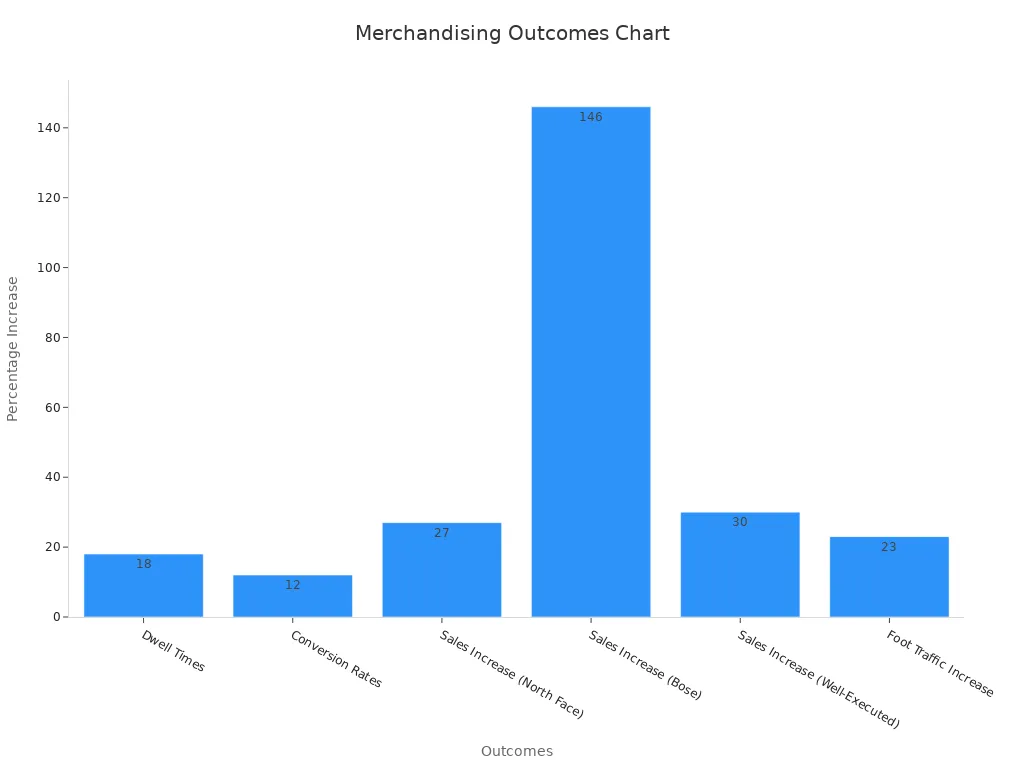
By executing these strategies, you can achieve measurable outcomes. For example, North Face stores with immersive displays saw a 27% sales increase, while Bose experienced a 146% boost in optimized locations.
Note: Regularly monitor your metrics and adjust your displays to maintain their effectiveness. This iterative approach ensures sustained success.
Week 4: Testing and Optimizing for Success
Measuring Key Performance Indicators (KPIs)
Tracking the right KPIs ensures your merchandising strategy delivers measurable results. Focus on metrics that directly reflect the performance of your displays and inventory. These KPIs provide actionable insights:
KPI | Description |
|---|---|
Return Ratio | Indicates sales performance relative to shelf space allocation. |
Accuracy of Product Facings | Assesses alignment of actual facings with planned assortment strategy. |
Sales per Linear Meter | Measures revenue generated per meter of shelf space, aiding in performance comparisons. |
Profitability per Facing | Evaluates profitability of each facing, providing insight into revenue generation efficiency. |
Inventory Profitability | Measures profit generated per unit of inventory displayed, accounting for stock behind the facing. |
Regularly monitor these KPIs to identify areas for improvement. For example, if the return ratio is low, consider reallocating shelf space to higher-performing products. Use these metrics to refine your strategy and maximize profitability.
Tip: Automate KPI tracking with analytics tools to save time and ensure accuracy.
Collecting and Analyzing Customer Feedback
Customer feedback is essential for understanding how your merchandising strategy resonates with shoppers. Use multiple methods to gather insights:
Website and in-product surveys to capture feedback during the shopping experience.
Feedback buttons for continuous input without disrupting the customer journey.
Email surveys to collect feedback at scale.
Mobile app surveys for on-the-go insights.
Chat surveys to capture real-time sentiment.
In-app messaging surveys triggered by user behavior.
Surveys embedded in third-party tools like HubSpot for automated collection.
Consolidate this feedback using tools like Survicate’s Insights Hub. This platform organizes data from various sources, making it easier to identify trends and actionable insights. By analyzing feedback, you can address customer pain points and improve their experience.
Iterating and Refining the Strategy
Refining your merchandising strategy requires an iterative approach. This process involves cycles of planning, testing, and feedback. Each cycle allows you to make incremental improvements based on performance data and customer input. For example:
Test different display arrangements to see which generates higher sales.
Use customer feedback to adjust product placements or highlight new items.
Monitor KPIs to identify underperforming areas and make necessary changes.
This trial-and-error method ensures your strategy evolves with changing customer preferences and market trends. Over time, these refinements lead to a more effective and customer-centric merchandising approach.
Callout: Iteration is key to long-term success. Continuously test and adapt to stay ahead of the competition.
Case Study: From Data Swamps to Strategy in 30 Days
The Business Challenge and Initial State
Imagine a retailer struggling with disorganized data scattered across multiple systems. Sales figures, customer feedback, and inventory reports existed in silos, creating a classic "data swamp." This lack of integration made it nearly impossible to identify trends or make informed decisions. The retailer faced declining sales, inefficient inventory management, and missed opportunities to engage customers. They needed a solution to transform their data swamp into a clear, actionable merchandising strategy within 30 days.
Steps Taken to Transform Data into Actionable Strategy
The retailer followed a structured approach to tackle the problem:
Collected data from various sources, including sales reports, customer surveys, and social media analytics, to gain a comprehensive view of their business.
Analyzed the data using descriptive and predictive analytics tools to uncover patterns and insights.
Applied these insights to optimize merchandising strategies, such as prioritizing high-demand products, adjusting pricing, and refining marketing campaigns.
This step-by-step process ensured that every decision was backed by data, reducing guesswork and improving efficiency.
Results and Key Takeaways
The transformation delivered measurable results:
Metric | Target/Goal |
|---|---|
Percentage increase in sales | |
Number of new customers acquired | 500 new customers |
Average inventory holding period | Reduced by 15% |
GMROI | Increased to 2.5 |
Sell-through rate | Improved by 15% |
Inventory shrinkage rate | Reduced by 20% |
Stockout rate | Maintained below 5% |
For example, IKEA achieved a 17% increase in conversion rates by optimizing in-store layouts and personalizing e-commerce experiences. Similarly, Starbucks used AI-driven insights to improve new location performance by 15%. These examples highlight how a focused strategy can turn data swamps into actionable plans.
Takeaway: A clear roadmap and the right tools can help you transform disorganized data into a powerful merchandising strategy, driving both sales and customer satisfaction.
Tools and Resources for Merchandising Success
Data Analysis Tools for Merchandising
Data analysis tools help you uncover patterns and trends in your merchandising data. These tools simplify complex datasets, making it easier to make informed decisions. For example, platforms like Tableau and Power BI allow you to visualize sales performance, inventory turnover, and customer behavior. By using these tools, you can identify which products perform well and which need better placement.
Real-time analytics tools, such as Google Analytics or Looker, provide insights into customer preferences. They help you track metrics like conversion rates and average transaction values. This information allows you to adjust your merchandising strategy quickly. Automating data analysis also saves time and reduces errors, ensuring your decisions are based on accurate information.
Tip: Choose tools that integrate seamlessly with your existing systems to streamline data collection and analysis.
Frameworks for Strategy Development
Frameworks provide a structured approach to developing your merchandising strategy. The 7Ps Marketing Mix is a comprehensive checklist that ensures you consider all aspects of your strategy. It includes Product, Price, Place, Promotion, People, Process, and Physical Evidence. This framework helps you align your merchandising efforts with your business goals.
Another effective approach is the Blue Ocean Strategy. This framework encourages you to innovate by enhancing features competitors lack and eliminating unnecessary elements. For example, you could create unique product displays that stand out in the market. This strategy helps you attract new customers and build a competitive edge.
To get started, follow these steps:
Identify your core challenge, such as low sales.
Define your target audience and refine customer personas.
Analyze barriers to purchase, like unclear product value.
Callout: Frameworks like these simplify decision-making and ensure your strategy remains focused and effective.
Software for Visual Merchandising and Layout Design
Visual merchandising software enhances your store layout and display effectiveness. Advanced tools like SmartDraw and MockShop offer features such as floor plan creation and sales reporting. These tools help you identify profitable changes in your store layout. For example, dynamic range planners adapt to different store sizes, ensuring optimal product placement.
Some software solutions provide insights into product assortment, facings, and stackings. They also evaluate how displays impact sales in nearby areas. This information helps you maximize the effectiveness of your merchandising efforts. By using these tools, you can create visually appealing displays that drive customer engagement and boost sales.
Note: Regularly evaluate your software’s performance to ensure it meets your merchandising needs.
Transforming data swamps into actionable strategies is not just a necessity—it’s a game-changer for your merchandising success. By following this 30-day roadmap, you’ve learned how to clean and prioritize data, develop a strategy, implement it effectively, and refine it through testing.
Tip: Start small. Focus on one area, such as organizing your data or setting clear goals, and build momentum from there.
Every step you take brings you closer to a more efficient, customer-focused merchandising approach. Take the first step today and turn your data into a powerful tool for growth.
FAQ
What is a data swamp, and how does it affect merchandising?
A data swamp is a collection of disorganized, unstructured data that lacks usability. It prevents you from extracting insights, slows decision-making, and impacts merchandising performance. Cleaning and organizing this data is essential to create actionable strategies.
How can I identify high-value data points for merchandising?
Focus on metrics that directly impact your goals. Look at sales trends, customer preferences, and inventory turnover rates. Use tools like analytics software to uncover patterns and prioritize data that drives results.
What tools can help me clean and structure merchandising data?
Data cleaning tools like OpenRefine or Excel can help you remove duplicates and organize information. For advanced needs, use platforms like Tableau or Power BI to visualize and structure data effectively.
How do I measure the success of my merchandising strategy?
Track KPIs like sales per square foot, inventory turnover, and customer satisfaction scores. These metrics show how well your displays perform and help you refine your strategy for better results.
Can I implement this strategy without advanced technical skills?
Yes, you can start with basic tools like spreadsheets and simple analytics platforms. Focus on organizing data and setting clear goals. As you progress, explore more advanced tools to enhance your strategy.
See Also
Effective Strategies for Retail Demand Forecasting Weekly
Creating A Data-Centric Stage-Gate For Retail Launches
Framework And KPIs For SKU Rationalization Using Data
Transforming Consumer Behavior Insights Into Business Actions
Learning From Data-Intensive Retail: Predicting Consumption Trends