
How Enterprises Apply Sales Data, Inventory & Procurement Data to Unlock Operational Gains
Enterprises use sales data, inventory, and procurement analytics to optimize operations, reduce costs, and improve decision-making for measurable gains.

You can unlock significant operational improvements by analyzing enterprise data effectively. Using sales data provides insights into customer preferences, helping you align your strategies with market demand. Inventory data ensures you maintain optimal stock levels, preventing overstocking or shortages. Procurement data allows you to evaluate supplier performance and control costs. Together, these datasets empower you to streamline processes, reduce expenses, and make informed decisions that drive measurable outcomes.
Key Takeaways
Study sales data to learn what customers like and set better prices, making operations smoother.
Use inventory data to keep the right amount of stock, avoiding too much or too little, and keeping customers happy.
Use procurement data to check how well suppliers do and manage costs, improving supplier ties and saving money.
Combine business data to make tasks easier and use automation, saving money and helping make better choices.
Use prediction tools to guess future demand, matching stock to customer needs and earning more money.
Defining Sales, Inventory, and Procurement Data
Sales Data: Key Insights for Operational Success
Sales data provides you with a clear picture of customer behavior and market trends. By analyzing this data, you can identify which products perform well and which regions offer growth opportunities. For example, sales analytics can help you focus on the most effective channels and optimize pricing strategies based on customer responses.
Insight Type | Description |
|---|---|
Informed Decision Making | Focus efforts on the most effective channels and products. |
Identifying Growth Opportunities | Spot successful products in specific regions for expansion. |
Improving Operational Efficiency | Pinpoint customer loss areas and refine strategies. |
Optimizing Pricing Strategies | Determine ideal price points based on customer feedback. |
Enhancing Customer Retention | Highlight popular products to improve marketing and retention. |
By leveraging sales data, you can make informed decisions that enhance operational efficiency and customer satisfaction.
Inventory Data: Optimizing Stock Levels and Efficiency
Inventory data helps you maintain the right stock levels, ensuring smooth operations. Efficient inventory management prevents overstocking, which increases costs, and understocking, which leads to missed sales opportunities.
Excess Inventory: Too much stock increases storage costs and ties up resources.
Transit Inventory: Items in transit require careful tracking to avoid delays.
Cycle Inventory: Regular fluctuations in stock levels impact cost efficiency.
Book Inventory: Accurate records ensure better control over inventory levels.
Studies show that improving inventory management directly boosts operational performance. For instance, using ABC Analysis or Economic Order Quantity can significantly enhance efficiency. By optimizing inventory, you reduce waste and improve your ability to meet customer demand.
Procurement Data: Enhancing Supplier Relations and Cost Management
Procurement data allows you to evaluate supplier performance and manage costs effectively. By analyzing key performance indicators like on-time delivery and quality scores, you can identify top-performing suppliers and strengthen relationships.
Use data to detect overspending and optimize budgets.
Consolidate suppliers to secure volume discounts.
Forecast potential disruptions to mitigate risks.
Procurement analytics also supports better negotiation terms, helping you achieve cost savings. With these insights, you can build a resilient supply chain and improve overall operational efficiency.
Benefits of Leveraging Enterprise Data
Unlocking Cost Savings Through Data Analytics
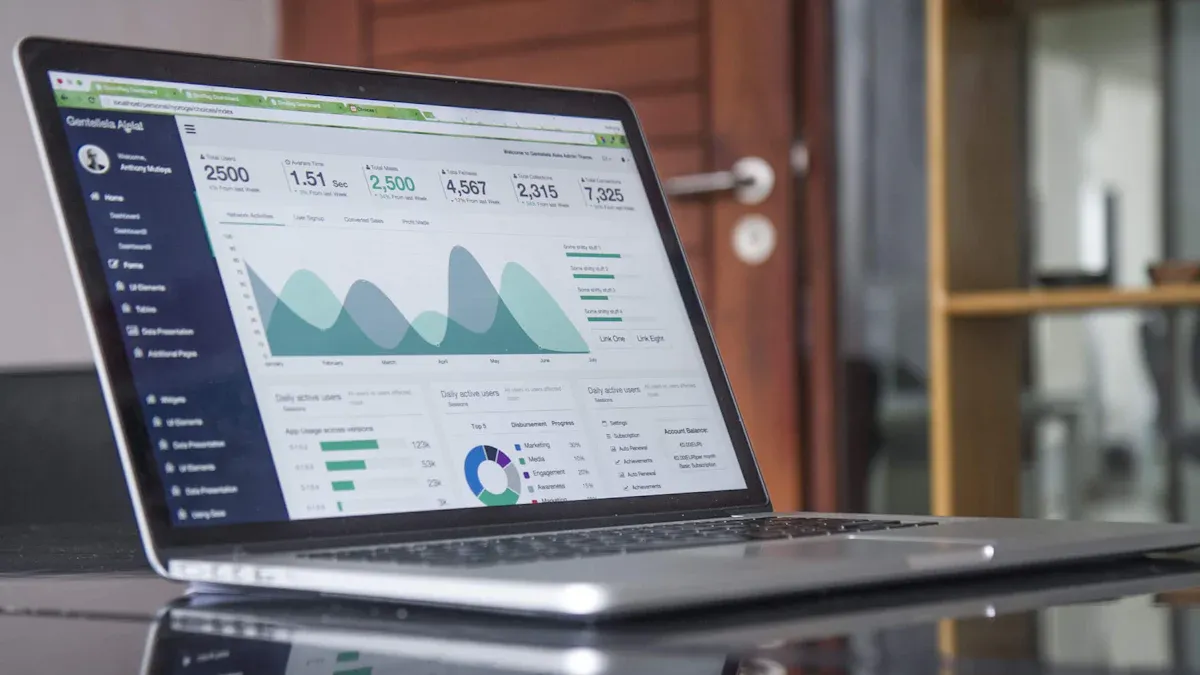
Analyzing enterprise data helps you identify inefficiencies and reduce operational costs. By integrating sales data, inventory data, and procurement data, you can eliminate redundancies and automate processes. For example, unified data systems streamline workflows, saving time and resources.
Companies that adopt integrated processes experience significant cost reductions. Studies show that operational costs decrease by approximately 50% when automation and data integration are implemented. Firms that fail to use integrated systems incur costs up to 40% higher than their counterparts.
Evidence Type | Description |
|---|---|
Average Cost Savings Figures | Companies adopting integrated processes see a reduction of approximately 50% in operational costs. |
Industry Benchmarks | Firms not using integrated processes incur costs up to 40% higher than those that do. |
Factors Contributing to Cost Efficiency | Automation, unified data systems, and elimination of redundancies lead to significant savings. |
By leveraging enterprise data, you can achieve measurable cost savings and allocate resources more effectively.
Improving Forecasting Accuracy and Demand Planning
Enterprise data enhances your ability to predict future demand and plan inventory accordingly. Using sales data and predictive analytics, you can anticipate customer needs and avoid stockouts or overstocking. This improves operational efficiency and boosts revenue.
Businesses using predictive analytics for demand forecasting report a 10% to 15% increase in revenue.
Real-time demand analytics reduce forecast errors by 10% to 20%.
Automation and integration with existing systems streamline operations and reduce manual workloads.
For instance, a pharmaceutical company partnered with Nexgensis Technologies to improve demand planning. The collaboration resulted in better forecast accuracy and operational efficiency. Continuous improvement in forecasting methods ensures you stay ahead of market trends and customer expectations.
Evidence Type | Description |
|---|---|
Forecast Accuracy Improvement | Expectation of a 10% to 20% increase in forecast accuracy through data-driven demand forecasting. |
Revenue Increase | Businesses using predictive analytics for demand forecasting see a 10% to 15% revenue increase. |
Reduction in Forecast Errors | Companies utilizing real-time demand analytics experience a 10-20% reduction in forecast errors. |
Driving Smarter Decision-Making Across Operations
Data integration empowers you to make informed decisions across all areas of your business. By consolidating sales data, inventory data, and procurement data, you gain a comprehensive view of your operations. This enables you to identify patterns, uncover opportunities, and refine strategies.
Data-driven decision-making helps you maintain competitiveness in changing environments. It also uncovers productivity bottlenecks and optimizes resource use, leading to better efficiency.
Benefit | Description |
|---|---|
Comprehensive Data View | Data integration provides a complete and accurate view of data, enabling decisions based on evidence. |
Enhanced Collaboration | It fosters collaboration and data sharing, streamlining processes and improving operational efficiency. |
Maximized Data Value | Organizations can harness information from various sources, identifying patterns and business opportunities. |
For example, integrating data across departments fosters collaboration and improves communication. This ensures that your teams work together effectively to achieve operational goals. By relying on data, you can make smarter decisions that drive measurable outcomes.
Overcoming Challenges in Data Integration
Breaking Down Data Silos for Unified Insights
Data silos create barriers to achieving a unified view of your business operations. These silos often arise when departments store data in isolated systems, making it difficult to share information across teams. Breaking down these silos requires a strategic approach to data governance and integration.
A strong data governance framework ensures data quality, accessibility, and integrity across your organization. This framework fosters collaboration and enables decision-making based on a single source of truth. To achieve this, you can:
Implement centralized data governance to define ownership and accountability.
Connect disparate systems through data integration tools to create a unified platform.
Build AI-ready data architecture to support advanced analytics and decision-making.
By adopting these strategies, you can eliminate silos and unlock the full potential of your enterprise data.
Addressing the Skills Gap in Data Analytics
The growing demand for data analytics has highlighted a significant skills gap in many organizations. This gap often stems from a mismatch between the skills taught in academic settings and those required in the workplace. For example, studies show that healthcare professionals face challenges in applying theoretical knowledge to practical scenarios.
Study Title | Findings | Purpose |
|---|---|---|
Understanding and Measuring Skill Gaps in Industry 4.0 | Research reveals the need for mapping actual skill gaps. | To explore perspectives and improve measurement approaches. |
Big-Data Skills: Bridging the Data Science Theory-Practice Gap in Healthcare | Identifies discrepancies between classroom skills and workplace needs. | To inform curriculum development for data scientists and professionals. |
To address this gap, you can invest in upskilling your workforce through targeted training programs. Partnering with educational institutions to align curricula with industry needs can also help bridge this divide. By equipping your team with the right skills, you can maximize the value of your data analytics initiatives.
Ensuring Data Quality and Consistency
Maintaining high-quality data is essential for accurate analysis and decision-making. Poor data quality can lead to errors, inefficiencies, and missed opportunities. To ensure consistency, you can adopt proven quality assurance methodologies:
Technique | Description |
|---|---|
Random Sampling | Perform spot checks against original source data. |
Double Data Entry | Identify discrepancies through independent entries. |
Statistical Metrics Monitoring | Track data completeness and consistency over time. |
Validation with Benchmarks | Compare results with external datasets or industry standards. |
Additionally, data profiling techniques, such as analyzing statistical distributions and identifying outliers, can help you uncover inconsistencies. Regular audits and cross-column analysis ensure that your data adheres to business rules and logical relationships. By prioritizing data quality, you can build a reliable foundation for your analytics efforts.
Strategies for Applying Data Analytics
Centralizing Data for Comprehensive Analysis
Centralizing your data creates a unified platform for analysis, making it easier to uncover insights and improve decision-making. When data is scattered across multiple systems, it becomes challenging to assess risks or identify trends. By consolidating your data, you can streamline operations and enhance knowledge retention.
Effective data management improves decision-making processes.
Automated systems and data warehouses simplify access to insights.
Centralization reduces data overload, enabling better risk assessment.
Centralized management also enhances governance, cost allocation, and innovation. Studies show that small- and medium-sized enterprises benefit significantly from centralization, especially private, family-owned, and manufacturing firms.
Key Findings | Description |
|---|---|
Centralization Impact | High centralization positively affects performance in small- and medium-sized enterprises but not in large firms. |
Heterogeneity Analysis | Centralization benefits private, family, and manufacturing firms more than others. |
Governance Improvement | Centralized management enhances cost allocation and technology innovation, potentially leading to better performance. |
By centralizing your data, you can create a foundation for comprehensive analysis and unlock operational gains.
Translating Data Insights into Business Outcomes
Turning data insights into actionable strategies helps you achieve tangible business results. For example, analyzing customer segments allows you to design tailored marketing campaigns that boost engagement and conversions. Similarly, sales trend analysis enables you to adjust inventory and marketing efforts based on demand spikes.
Key Insights | Real-World Business Impact |
|---|---|
Identifying Customer Segments | Tailored marketing campaigns led to higher engagement and conversion rates. |
Sales Trend Analysis | Adjusted inventory and marketing efforts based on identified demand spikes. |
Performance Benchmarking | Set realistic targets for sales teams based on industry standards. |
Notable increase in overall sales revenue after implementing data-driven changes. | |
Analyzing Historical Trends | Improved patient adherence and reduced emergency room visits related to diabetes. |
Cost savings for both patients and the healthcare system due to better diabetes management. |
When you translate insights into actions, you can improve operational efficiency and drive measurable outcomes. For instance, benchmarking performance against industry standards helps set realistic goals for your teams. By leveraging historical trends, you can also enhance customer experiences and reduce costs.
Implementing Predictive Analytics for Demand Forecasting
Predictive analytics helps you anticipate future demand and optimize inventory planning. Using advanced models, you can forecast sales trends with greater accuracy and reduce uncertainty. For example, autoregressive components of sales variables improve forecasting performance, while multivariate models work well for products with stable demand.
Model Type | Findings |
|---|---|
Autoregressive Components | Better performance using autoregressive components of sales variables. |
Multivariate Models | More effective than univariate models for regular products with low demand uncertainty. |
Machine Learning Techniques | ANN and Random Forests reported improvements in accuracy and interpretability. |
External Indicators | Weather and economic factors significantly influence sales predictions. |
Hybrid Models | Combining time-series and machine learning methods enhances forecasting accuracy. |
Machine learning techniques, such as artificial neural networks (ANN) and random forests, further enhance accuracy and interpretability. Hybrid models that combine time-series analysis with machine learning deliver even better results. By incorporating external indicators like weather and economic factors, you can refine your predictions and stay ahead of market trends.
Predictive analytics empowers you to make proactive decisions, ensuring you meet customer demand while minimizing costs.
Leveraging AI and Machine Learning for Operational Gains
Artificial intelligence (AI) and machine learning (ML) have transformed how businesses operate. By applying these technologies, you can automate processes, uncover patterns, and make faster decisions. These tools analyze vast amounts of data to deliver actionable insights, helping you achieve operational efficiency and measurable gains.
Automating Repetitive Tasks
AI excels at handling repetitive tasks that consume time and resources. For example, you can use AI-powered chatbots to manage customer inquiries or automate invoice processing to reduce manual errors. This frees up your team to focus on strategic activities.
Tip: Automating routine tasks not only saves time but also improves accuracy, ensuring consistent results across operations.
Enhancing Decision-Making with Predictive Models
Machine learning models predict future trends by analyzing historical data. These predictions help you plan inventory, optimize procurement, and anticipate customer needs. For instance, ML algorithms can identify seasonal sales patterns, allowing you to adjust stock levels proactively.
Benefit | Description |
|---|---|
Improved Forecast Accuracy | ML models analyze historical trends to predict future demand. |
Faster Decision-Making | AI processes data quickly, enabling real-time adjustments to operations. |
Risk Mitigation | Predictive analytics highlight potential disruptions, helping you prepare in advance. |
Driving Operational Gains Across Industries
AI and ML deliver tangible benefits across various sectors. In finance, AI reduces fraud and speeds up loan approvals. In retail, ML enhances customer personalization and inventory management. Below are examples of operational gains achieved through AI and ML:
Company | Operational Gain Description | Percentage Gain/Reduction |
|---|---|---|
FinSecure Bank | Reduction in financial fraud | |
QuickLoan Financial | Improvement in loan processing times | 40% |
CapitalGains Investments | Increase in annual returns through market trend analysis | 20% |
Unnamed Company | Increase in approved loans and reduction in default rates | 40% increase, 25% reduction |
These examples highlight how AI and ML can drive efficiency, reduce risks, and improve profitability.
Personalizing Customer Experiences
AI-powered systems analyze customer data to deliver personalized experiences. You can use recommendation engines to suggest products based on purchase history or deploy sentiment analysis tools to understand customer feedback. Personalization enhances customer satisfaction and builds loyalty.
Note: Studies show that personalized experiences increase customer retention rates by up to 30%.
Scaling Operations with AI
AI enables you to scale operations without proportional increases in costs. For example, machine learning algorithms can handle growing datasets without compromising performance. This scalability ensures that your business remains agile and competitive as it expands.
By leveraging AI and ML, you can unlock operational gains that drive efficiency, reduce costs, and improve customer satisfaction. These technologies empower you to stay ahead in a rapidly evolving business landscape.
Real-World Applications and Success Stories
Retailer Enhances Inventory Management with Sales Data
Retailers have achieved remarkable improvements in inventory management by leveraging sales data. For example, Walmart uses real-time inventory tracking and machine learning to align stock levels with customer demand. This approach reduces stockouts and overstock situations, ensuring customers find what they need when they need it.
Other companies have also seen significant results:
Company A integrated sales data with external factors, reducing overstock by 30% and stockouts by 20%.
Manufacturer B used predictive analytics to analyze historical data, cutting inventory holding costs by 25% and improving on-time delivery by 15%.
These strategies highlight how sales data can optimize inventory processes, reduce costs, and enhance customer satisfaction.
Manufacturer Reduces Costs Using Procurement Analytics
Manufacturers have successfully reduced costs by applying procurement analytics. Procter & Gamble streamlined its supply chain processes, achieving a 60% reduction in touchpoints. This change led to faster operations and lower costs.
Key metrics from other manufacturers demonstrate the impact of procurement analytics:
Metric | Outcome |
|---|---|
Over 5% | |
Supplier base optimization | Consolidated multiple vendors |
Managed competition | Largest contributor to savings |
Split manufacturing strategy | Make vs. buy approach |
Supplier renegotiations | Replacements for better pricing |
By consolidating suppliers and renegotiating contracts, manufacturers can achieve significant savings and build more resilient supply chains.
E-commerce Company Improves Customer Experience with Data Insights
E-commerce companies use data insights to enhance customer experiences. Mapping customer interactions helps identify pain points and improve satisfaction. Personalization strategies, such as tailored product recommendations, boost engagement and loyalty.
For instance, advanced segmentation techniques allow businesses to adjust marketing strategies in real time. AI and predictive analytics forecast customer behavior, enabling proactive solutions to potential issues. Studies show that increased use of big data directly improves customer satisfaction.
Integrating customer feedback into decision-making further enhances the experience. Real-time feedback loops provide insights into customer sentiments, allowing businesses to make timely improvements. These strategies ensure e-commerce companies stay competitive while delivering exceptional service.
Enterprises that harness sales, inventory, and procurement data unlock measurable operational gains. Data-driven insights streamline processes, reduce costs, and improve decision-making. For example, organizations that adopt a data-driven approach are more likely to thrive during crises and achieve higher profitability, as highlighted by the Harvard Business Review.
Key Metrics Driving Success:
Metric | Description |
|---|---|
Mean (μ) | Average time taken for processes, calculated to evaluate performance over time. |
Standard Deviation (σ) | Measures variability in process durations, indicating reliability and areas for improvement. |
Utilization Rate (%) | Indicates how effectively resources are used, calculated to identify potential bottlenecks. |
In retail, analyzing consumer behavior enhances marketing campaigns. In SaaS, identifying popular features improves product development. These examples show how leveraging data helps businesses anticipate trends and adapt to changing demands.
Tip: Begin utilizing your enterprise data today to drive operational improvements and achieve measurable success.
FAQ
What is the importance of integrating sales, inventory, and procurement data?
Integrating these datasets gives you a unified view of operations. It helps you identify inefficiencies, optimize stock levels, and improve supplier relationships. This integration ensures better decision-making and reduces costs.
How does predictive analytics improve demand forecasting?
Predictive analytics uses historical data to anticipate future trends. It helps you plan inventory, avoid stockouts, and reduce overstocking. By analyzing patterns, you can align operations with customer demand.
What are the challenges of breaking down data silos?
Data silos limit collaboration and create fragmented insights. Overcoming them requires centralized systems, data governance frameworks, and integration tools. These strategies ensure seamless data sharing across departments.
How can AI and machine learning benefit operational efficiency?
AI and machine learning automate repetitive tasks, analyze large datasets, and provide actionable insights. They help you improve forecasting, optimize processes, and personalize customer experiences. These technologies drive measurable operational gains.
What steps can you take to ensure data quality?
You can ensure data quality by performing regular audits, using validation techniques, and monitoring statistical metrics. Random sampling and cross-column analysis also help maintain consistency and accuracy in your datasets.
See Also
Creating A Cohesive Data Mart For S&OP Strategy
Methods For Basket Analysis In Retail Data Teams
Understanding Consumption Trends Through Data-Driven Retail Insights