
Singdata Customer Reviews and ROI: A Buyer's Guide to Evidence and Payback
How to read Singdata customer reviews and build a defensible ROI case: requirement criteria, TCO categories, payback math, pilot tests, and clearly labeled vendor-reported claims.
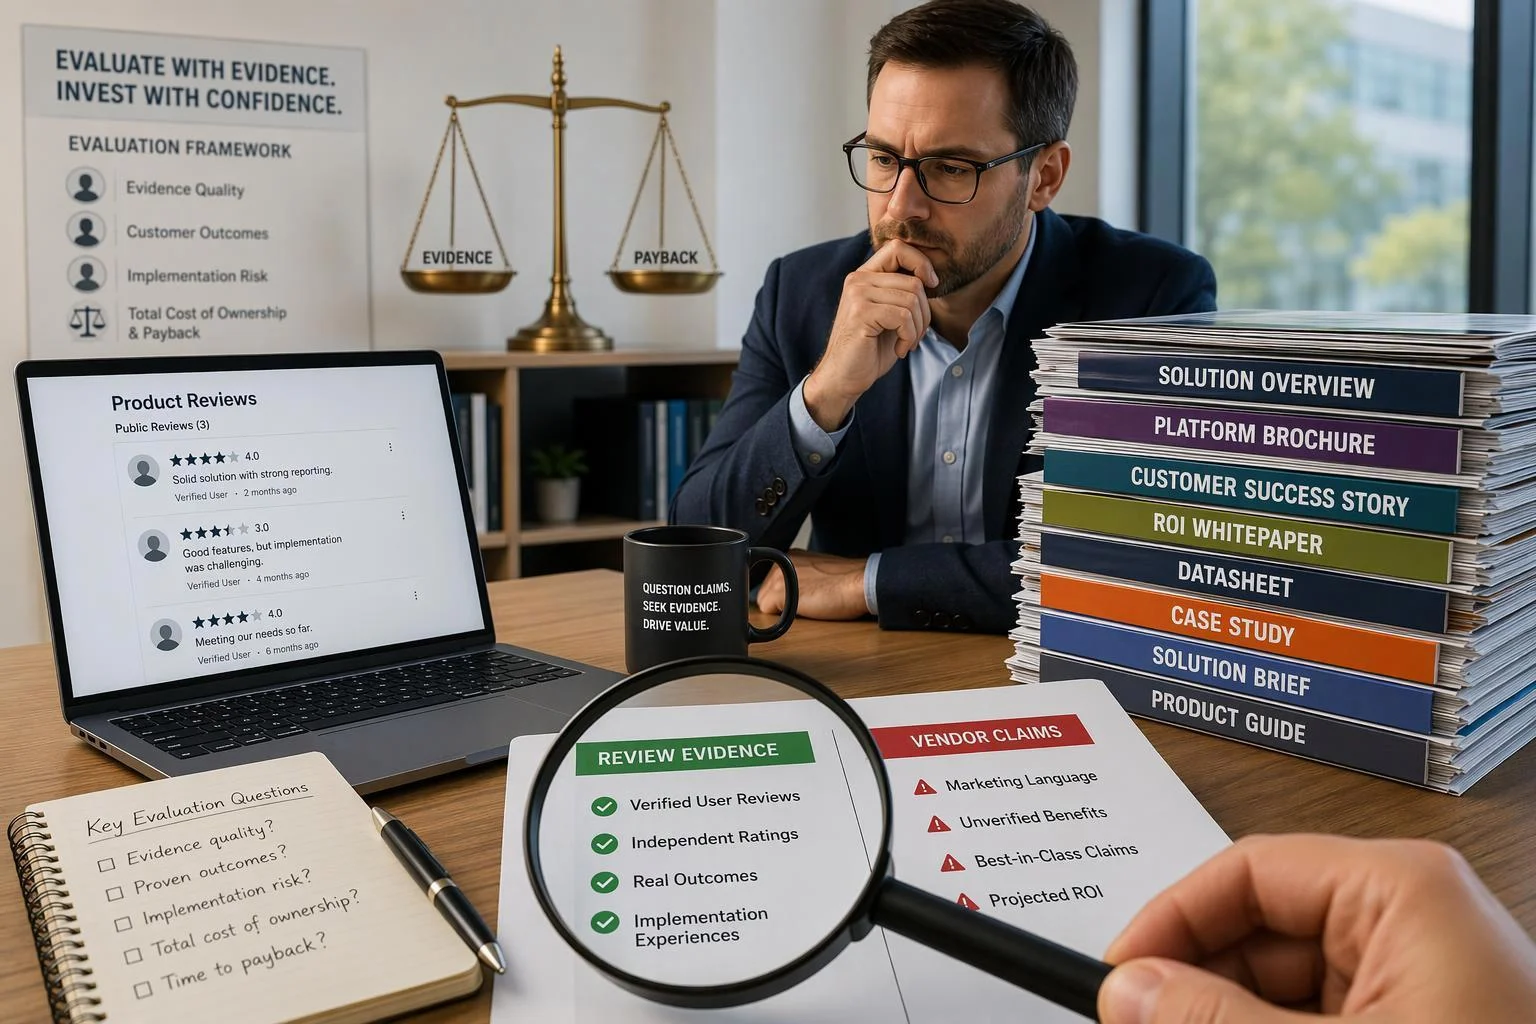
If you are evaluating Singdata Lakehouse, you will hit the same wall most buyers do: independent review coverage is thin, and almost everything substantive you can read about performance and cost was written by the vendor. That is not a verdict on the product. It is a statement about the evidence available in November 2026, and it changes what a defensible evaluation looks like.
This guide does two things. First, it gives you a way to separate credible review evidence from vendor-authored claims, so you can tell what a piece of public material actually establishes. Second, it walks through building an ROI case from your own measured baseline — requirement set, total cost of ownership, payback — rather than from a headline percentage.
Three ground rules apply throughout. Only publicly available material is used. Every vendor-reported figure is labeled as such and paired with what a buyer would need to verify. No customer quotes, review counts or ROI numbers are invented. The progression is the one a procurement decision actually follows: define your requirements, read the evidence against them, build the cost model, test the claims in a pilot, then decide.
Start With Your Own Requirements, Not the Review Score
A review only means something relative to a stated requirement set. A positive account from a construction or insurance data team may describe a very different workload from a high-concurrency SaaS platform, and a benchmark that flatters one will say little about the other. Write your requirements down before you open any review page, so the review is tested against your criteria rather than shaping them.
The profile that matters for a lakehouse decision has seven parts:
Data volume and growth rate. Current stored volume, daily ingest, and a realistic two-year growth curve. Growth rate drives storage and compaction cost more than current volume does.
Batch versus streaming mix. How much of your pipeline is scheduled batch, how much is continuous ingestion, and how fresh the results must be. A team that needs minute-level freshness is buying a different product from one that runs overnight.
Concurrency and SLA targets. Peak concurrent queries, peak ingest jobs, and the latency your business users or downstream systems will actually tolerate at that peak.
Existing lake formats and migration tolerance. Whether you hold data in Iceberg, Delta Lake, Hive or plain object storage, and whether a migration is acceptable at all. Singdata's documentation states that Lakehouse can mount existing S3/OSS/COS object storage and query Hive, Iceberg and Delta Lake through an External Catalog without data migration — a claim to test against your own tables, not to assume.
SQL compatibility requirements. Which dialects, functions and scheduling semantics your existing jobs depend on. Compatibility is where migration cost hides.
Governance and multi-tenancy. Row- and column-level access control, tenant isolation if you serve customers from one platform, audit requirements, and data residency constraints.
AI and agent workloads, if relevant. Whether natural-language analytics, vector search or model invocation sit inside the platform or beside it, and what that implies for permission boundaries.
One useful calibration point: PeerSpot's page for Singdata Lakehouse lists construction companies (39%) and insurance companies (27%) as the largest share of visitors reading reviews in that category, as of November 2026. That describes who is researching the product, not who has deployed it and not what their workloads look like. Treat it as context for why review coverage may skew toward particular industries, not as evidence about fit.
When the list is written, score each candidate platform against it before reading any narrative material. A requirement you cannot test is a requirement you have not defined.
How to Read Singdata Customer Reviews Credibly
Start with what actually exists. As of November 2026, PeerSpot's Singdata Lakehouse page states that it has not yet collected reviews for the product and invites users to submit one. The same page reports a 0.3% mindshare in PeerSpot's AI Data Analysis category, calculated from user engagement data. Listings also exist on AWS Marketplace and the G2 AI Marketplace; review counts on those pages change, so check the live pages at the time you read them rather than relying on any number quoted secondhand, including in this article.
Thin coverage is a fact about the market, not a verdict on the product. It does mean that a review you do find carries more weight per data point — and deserves more scrutiny.
A credibility test you can apply to any review, on any platform:
Who wrote it. A named role, company size and industry that you can match to your own profile. An anonymous review from an unnamed company in an unrelated sector tells you almost nothing.
Whether the evaluation period and version are disclosed. A review of a 2024 build may describe a product that no longer exists. A review written during a two-week trial describes a trial.
Whether trade-offs and failures appear. A review with no downside is either very lucky or not decision-grade. The useful ones name what broke, what needed a workaround, and what the team stopped using.
Whether incentives are disclosed. Gift cards, raffles and sponsored placements are common on review platforms. Undisclosed incentives do not automatically invalidate a review, but they change how you weight it.
Whether the platform verifies the reviewer. Some platforms check employment or purchase records; others do not. Know which kind of page you are on.
Apply the same test to the vendor's own customer stories — NinjaVan, Zhijian and NeoCRM. These are first-party marketing artifacts. They are useful as hypotheses to test in your own environment, and they are not independent evidence. The next section shows why, using their own numbers.
What a Review Should Disclose — and What Vendor Case Studies Usually Omit
A review or case study becomes decision-grade when it discloses five things. Without them you can read the conclusion but you cannot check it.
Baseline architecture and cost before the change. What was running, at what scale, at what annual cost. A percentage improvement with no denominator is not a measurement.
Workload description. Query mix, data volume, concurrency, and whether the workload was batch, interactive or streaming.
Measurement period and version. When the comparison ran, over how long, and on which product version.
Metric definition. Wall-clock time, sum of query durations, cost per query, or monthly invoice — these are different quantities and can move in different directions.
Trade-offs accepted. What the team gave up, what required rework, and what remains unresolved.
The public Singdata case studies illustrate the gap. All figures below are vendor-reported.
NinjaVan. The case study reports a Spark-versus-Lakehouse comparison on sum duration: 8,938.80 seconds against 1,347.00 seconds, labeled a 564% improvement. It also describes a move from a self-built Spark + Flink + Presto + data lake architecture to a managed lakehouse, with 6x ETL performance improvement and 2x–10x BI performance improvement. The customers index page summarizes the same engagement as a one-third cost reduction with less than 1% code changes.
What the material does not disclose: the number of queries behind the sum-duration figure, the concurrency at which they ran, the hardware or cluster sizing on either side, or the measurement window. Sum duration is a legitimate metric, but it is sensitive to how many queries were in the set and how they were scheduled. A buyer should ask for the query set, the run conditions, and whether the comparison was run on the same data at the same time.
Zhijian. The case study reports a 40% reduction in overall TCO and states that more than 99% of SQL syntax and tasks required no adjustment, with the remainder resolved through communication with Singdata's technical team. It also reports that compute cost, measured against the previous cloud data warehouse, decreased by 40%.
Note the scope carefully: the 40% is described against the prior cloud data warehouse, in the context of a move away from a Lambda architecture, and the case study itself discusses hidden costs in self-managed platforms. It is not a general claim about any buyer's TCO. The material does not publish the baseline cost, the measurement window, or the full cost categories included.
NeoCRM. The case study describes a migration from Greenplum, a simulation of all 8,000 production tables, maximum synchronization latency below five minutes with most data arriving in under one second, and 100% data consistency confirmed by an online comparison tool. On SQL compatibility it states that the vast majority of workloads migrated without changes, with a small number of cases — such as certain date and time functions — requiring syntax adjustments.
This is the most operationally specific of the three, and it is still vendor-published. The 8,000-table simulation is a useful template for what to ask for: a defined table count, a defined latency measure, and a stated consistency check.
Do not reconcile or rank these figures against each other. They describe different architectures, different baselines and different metrics. The point is not which number is best; it is that each one tells you exactly which question to put to the vendor and which test to run yourself.
The Vendor-Reported Claims: What Singdata Publishes and How to Label It
Singdata publishes a set of performance and cost claims across its documentation, social channels, co-marketing and press releases. Each has a scope as published. The table below catalogs them with that scope and the verification each one implies. The labeling convention is reusable: vendor-reported — validate in pilot.
Claim as published | Where it appears | Scope as published | What a buyer must verify |
|---|---|---|---|
Performance "up to 10x faster than traditional Spark architectures" | TPC-DS / TPC-H / SSB benchmarks; "up to" qualifier; comparison to traditional Spark architectures | Run your own query set at your concurrency; confirm which benchmark queries map to your workload | |
"Up to 10x performance improvement over traditional systems like Spark," TCO at "1/5–1/3 of conventional alternatives" | Vendor narrative within a customer story; ranges, not point estimates | Both figures are ranges or ceilings; ask for the measured distribution behind them | |
"Zero migration," infrastructure cost "drops to 1/5" | 60-second marketing video; "0 migration" refers to mounting an existing data lake | Test mounting your own Iceberg/Delta/Hive tables; measure what still needs rewriting | |
"60% lower data architecture costs" | Joint-post headline: AutoMQ claims "over 50%" lower messaging infrastructure costs, while Singdata claims "up to 60%" lower overall compute and storage expenses — a Singdata "up to" ceiling, not an undifferentiated stack total | Separate the two vendors' contributions; treat the 60% as an "up to" ceiling on compute and storage | |
REDNOTE "drastically cut data processing latencies and lowered total operational costs" | Company-issued press release; qualitative, no figures | No numbers are published; treat as a reference to request, not a result to cite | |
564% sum-duration improvement; 6x ETL, 2x–10x BI | Single customer, specific migration, metric definitions as described above | Reproduce with your query set; confirm metric definition and run conditions | |
40% TCO reduction; 99%+ SQL compatibility | Single customer, against a prior cloud data warehouse | Establish your own baseline; test your SQL against the platform |
Two things are worth noticing about this catalog. First, the "up to" qualifiers and ranges are doing real work. "Up to 10x" is a ceiling across a benchmark suite, not a typical result, and "1/5–1/3" is a range whose position depends on what you are replacing. Second, the co-marketing and press-release items carry less evidentiary weight than the documentation, because their scope is a partnership narrative or an announcement rather than a described test.
None of this makes the claims false. It makes them hypotheses. The correct response to every row in the table is the same: reproduce the measurement in your own environment, on your own data, at your own concurrency, and compare the result to the vendor's stated scope.
Building the TCO Model: Cost Categories Buyers Commonly Miss
Most lakehouse cost comparisons understate the total because they compare list prices for compute and storage. The FinOps Foundation's guidance on data cloud platforms points at the categories that get missed: network and data movement costs, including transfer, replication, cross-region access and data sharing, which "can materially influence overall platform spend"; shared-resource attribution across teams; and commitment burn-down tracked against actual versus projected consumption.
A complete TCO for a lakehouse migration has seven lines:
Platform compute and storage. The metered bill.
Migration and rework effort. Engineering hours to port pipelines, rewrite incompatible SQL, re-validate reports and re-certify data quality. This is usually the largest one-time cost and the one most often omitted.
People and operations. Self-managed versus fully managed. A managed platform shifts headcount from cluster operations to data work; a self-managed one does the reverse. Count loaded cost, not headcount.
Orchestration and scheduling tooling. Whether the platform replaces Airflow, a separate scheduler or a streaming stack, and what remains alongside it.
Egress and cross-region data movement. Frequently free in a pilot and expensive at production scale.
AI and token consumption. If analytics agents or model calls are in scope, token spend is a separate, variable line.
Commitment risk. The cost of over-committing to an annual plan sized for a workload that shrinks, or of paying on-demand rates for a workload that grows.
Singdata's published metering gives you the first line in usable detail. Lakehouse pricing bills three resource types independently: compute metered by the second in CRU-hours, storage sampled through the day and averaged, and network data transfer metered on actual traffic. Storage is published at 0.017 USD/GiB/month on Alibaba Cloud Singapore and 0.025 USD/GiB/month on AWS Singapore, for both Enterprise and Standard editions. AWS Marketplace describes the same three dimensions, with 30 GiB of outbound data transfer included each month, and notes that compute typically dominates for query-heavy and ingestion workloads. The pricing calculator shows an illustrative Standard Edition configuration on Alibaba Cloud Singapore with compute at $0.80/CRU-hour and egress at $0.081/GB.
Analytics Agent pricing is separate: a $3,000/month subscription covering product authorization only, token usage billed from the first token at per-model rates, a token overage fee of $1,000 per additional 100M tokens above a 300M monthly threshold (partial blocks rounded up), and $0.008 per successful web-search call. The page is explicit that the data access fee is not included — queries the agent runs against Lakehouse are billed by Lakehouse under its own rules, on a separate bill.
Here is an illustrative TCO structure. Every number in it is hypothetical and exists only to show the shape of the model; it is not Singdata customer economics and should not be cited as such.
Cost category | Current (illustrative) | Post-migration (illustrative) | Notes |
|---|---|---|---|
Platform compute | $420,000 | $260,000 | Buyer's own metered estimate |
Storage | $60,000 | $55,000 | Volume × published unit price |
Egress / data movement | $25,000 | $30,000 | Often rises with consolidation |
Orchestration tooling | $40,000 | $15,000 | Assumes scheduler consolidation |
Platform operations staff | $300,000 | $180,000 | Loaded cost, managed shift |
Analytics Agent subscription + tokens | $0 | $36,000 | $3,000/month base, before overage |
Annual run cost | $845,000 | $576,000 | |
One-time migration and rework | — | $150,000 | Engineering hours, re-validation |
The model's value is in the categories, not the numbers. Fill each line from your own invoices and your own engineering estimates, and label any line you cannot source as an assumption.
Computing Payback and ROI From Your Own Baseline
The payback period measures how long it takes for an investment's cash inflows or savings to equal its original cost. The standard formula is initial investment divided by average annual cash flow. Investopedia notes the limitation directly: the method ignores the time value of money, the effects of inflation, and unequal cash flows over time. Pair it with a discounted measure — net present value or a discounted payback — when your finance team requires one, because payback alone will rank a fast, small return above a slower, larger one.
The calculation for a platform migration is straightforward once the baseline is measured:
Current annual cost = platform + storage + egress + tooling + loaded people cost.
Projected annual cost = the same categories after migration, including Singdata's metered compute, storage and transfer, plus any Analytics Agent subscription and token spend.
Annual savings = current minus projected.
Payback period = one-time migration and rework cost ÷ annual savings.
Using the illustrative figures from the previous section — clearly hypothetical, not observed data — annual savings are $845,000 − $576,000 = $269,000, and payback is $150,000 ÷ $269,000 ≈ 0.56 years, or roughly 6.7 months. State every assumption alongside the result: the migration estimate, the staffing change, the egress increase, and the assumption that the agent subscription runs for twelve months.
The most common error is substituting a vendor's percentage for step 3. If a case study reports a 40% TCO reduction, you cannot apply 40% to your current cost and call it savings, because the 40% was measured against a different baseline, over a different period, with a different set of cost categories included. The percentage is a hypothesis about direction and rough magnitude. Your measured delta is the input to the formula.
A second error is treating payback as the decision. A short payback on a migration that fails your SLA, your SQL compatibility requirements or your governance constraints is not a good outcome. Compute payback after the pilot, not before it.
What a 30/60/90-Day Pilot Can Realistically Verify
A pilot exists to resolve a named uncertainty, not to demonstrate the product. The Umbrex proof-of-concept playbook puts it well: write the uncertainty as a falsifiable statement — "we are unsure response times will be acceptable at peak" — and if you cannot phrase it as something that could be proven wrong, you are not ready to run a pilot. The same guidance recommends a four-to-six-week, three-stage structure, deliberately messy de-identified data, and a requirement that the vendor disclose any transformations it applies.
A structure that maps to the claims under test:
Stage 1 — Setup and baseline (weeks 1–2). Load a de-identified sample that includes missing attributes, near-duplicates and at least one record your validation rules should reject. Record your current baseline on the same data: query durations, concurrency, and cost per run. This baseline is what makes every later comparison meaningful.
Stage 2 — Capability and operability (weeks 2–4). Run a representative query set to test the performance claim, at your peak concurrency, and record wall-clock and sum duration separately so you can compare like with like. Meter actual CRU, storage and egress consumption to test the cost claim. Test SQL compatibility against your own workload — the Zhijian and NeoCRM case studies both describe near-full compatibility with minor syntax fixes, and both are vendor-reported, so your own job inventory is the test. Include at least one forced failure: kill a node, break a pipeline, and observe recovery and whether queries fail cleanly.
Stage 3 — Changeability and closure (weeks 4–6). Make a schema change and a permission change under realistic conditions, and time how long each takes without code. Confirm governance and multi-tenancy behavior: tenant isolation, row-level access, audit records. Close every open question with a written answer and an evidence link.
What a pilot cannot prove: long-run cost at scale, multi-year operational burden, and behavior under your future data growth. Those require a production period and a contract that lets you re-evaluate. Design the pilot so its outputs are decision artifacts — a test-case log with pass/fail and evidence, a gap list with mitigations, and a short note translating findings into implementation effort and risk.
Red Flags and Deal-Breakers
Keep red flags separate from deal-breakers. A red flag means slow down and ask harder questions. A deal-breaker means walk away.
Red flags — investigate before proceeding:
A review or case study with no baseline and no measurement window.
Benchmark figures presented without "up to" qualifiers or a workload description.
Cost comparisons that omit people, migration or egress.
No incentive disclosure on a review platform, or a review that reads as a product summary rather than an experience.
A pilot that refuses messy data, or that silently cleans and transforms it without telling you.
Pricing pages that cannot be reconciled to a metered invoice — if you cannot predict the bill from the published meters, you cannot budget for it.
A vendor that will not name the metric definition behind a performance claim.
Deal-breakers — buyer-defined, walk-away items:
Failure to meet your SLA under pilot load at your peak concurrency.
SQL or workload incompatibility that would require rewriting a material share of your pipelines, beyond what your migration budget allows.
Governance or data-residency gaps that your compliance function will not accept.
A TCO that fails your payback threshold even under optimistic assumptions.
Negotiate or mitigate rather than walk away:
A missing capability with a credible roadmap and a contractual commitment.
Compatibility gaps confined to a small, enumerable set of functions with a workaround.
Cost uncertainty that can be bounded by an on-demand start and a staged commitment.
Thin independent reviews, offset by a well-designed pilot and reference calls to customers who match your profile.
The distinction matters because treating every red flag as a deal-breaker eliminates viable options, and treating every deal-breaker as negotiable produces a contract you cannot live with.
Using the Criteria to Decide
The decision procedure is short, and its value comes from doing it in order.
Score each candidate against the written requirement list. Use the list from the first section, unchanged. If a requirement turns out to be untestable, rewrite it rather than dropping it.
Override paper scores with pilot evidence where they conflict. If a vendor claimed "configurable" and the pilot showed custom development, the pilot wins. Record the rationale in a decision log so the override is visible later.
Run a sensitivity check on the TCO weights. If the preferred option only wins under one narrow set of assumptions — for instance, only if staffing falls by a specific amount — you need either a mitigation commitment or a clearer priority decision from the steering committee.
Record the rationale. A one-page decision memo stating what was tested, what was proven, what failed, what risks remain, and what would change the recommendation.
An acceptance checklist for the procurement review:
Requirement list written and dated before any review was read.
Every piece of evidence labeled by source: independent review, vendor-reported, or buyer-measured.
Baseline documented: current architecture, current annual cost, current performance on the pilot query set.
TCO categories complete, including migration, people, orchestration, egress, AI/token consumption and commitment risk.
Payback computed from measured inputs, with every assumption stated and any discounted measure included if finance requires it.
Pilot checkpoints signed off, with pass/fail and evidence links.
Deal-breakers confirmed as met, and red flags either resolved or carried into the contract as priced options or vendor commitments.
Critical pilot findings translated into acceptance criteria in the statement of work.
Singdata is one option to be tested against these criteria, not the predetermined answer. The framework is designed to produce the same quality of decision whether the result is Singdata, a competitor, or a decision to stay where you are.
FAQ
Are there public Singdata customer reviews? As of November 2026, PeerSpot's Singdata Lakehouse page states that no reviews have yet been collected, and reports 0.3% mindshare in its AI Data Analysis category. Listings exist on AWS Marketplace and the G2 AI Marketplace; check the live pages for current review counts rather than relying on any figure quoted elsewhere.
Are the Singdata case studies independent? No. The NinjaVan, Zhijian and NeoCRM stories are published by Singdata on its own site. They are useful as hypotheses and as templates for what to ask for, but they are vendor-published and should be labeled as such in any business case.
Can I use the published 40% or 60% figures in my business case? Only as vendor-reported hypotheses about direction and rough magnitude. The 40% TCO figure comes from one customer measured against a prior cloud data warehouse; the 60% headline comes from a co-marketing post describing a combined architecture. Replace both with your own measured delta from a pilot before computing payback.
What does Singdata cost? Lakehouse bills compute per CRU-hour, storage per GiB-month (0.017 USD on Alibaba Cloud Singapore, 0.025 USD on AWS Singapore, both editions) and outbound transfer per GiB with 30 GiB included monthly. Analytics Agent adds a $3,000/month subscription, per-token usage from the first token, $1,000 per additional 100M tokens above 300M per month, and $0.008 per web-search call, with data access billed separately by the underlying platform. Prices and editions vary by region and cloud; confirm on the live pages.
How long should a pilot run? Four to six weeks in three stages, time-boxed, with written stop conditions if a gated item fails early. A longer pilot tends to drift into an implementation project and stops producing comparable evidence.