
What `spark.sql.autoBroadcastJoinThreshold` Actually Measures (and Why Your "Small" Table Still Gets Shuffled)
What spark.sql.autoBroadcastJoinThreshold measures, why a small dimension table still gets a sort-merge join, how it differs from broadcastTimeout, and how AQE changes the decision.
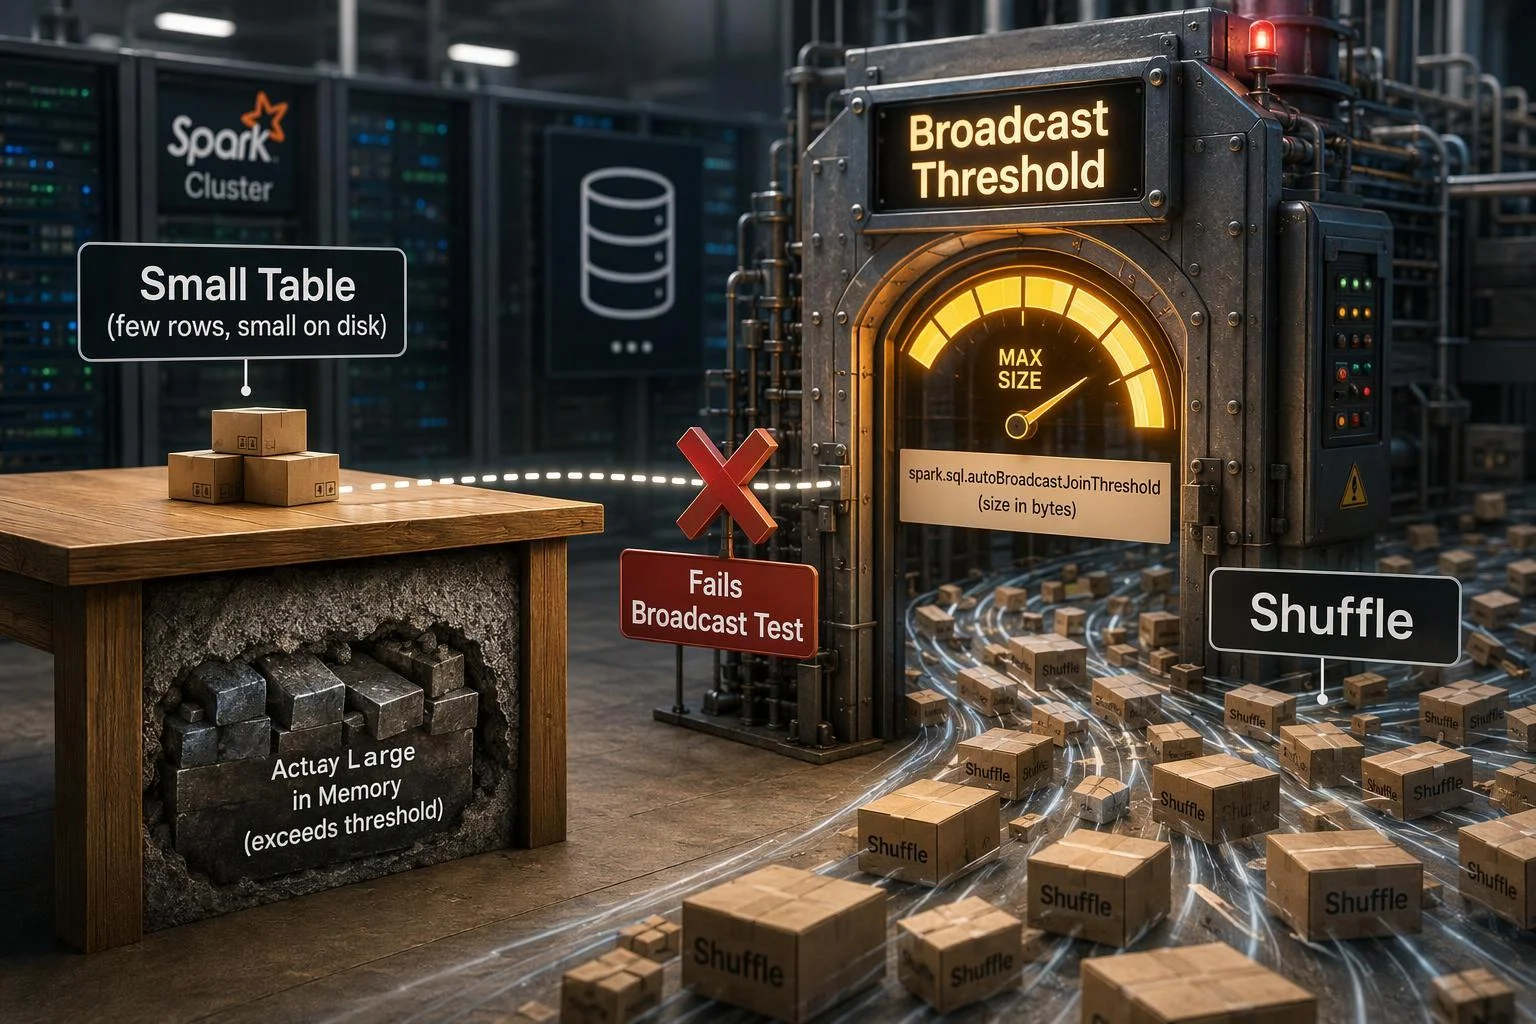
A 40,000-row dimension table can lose the broadcast join to a 200-million-row fact table. Row count is not what Spark compares. Neither is the size you see in your object store. The setting decides on an estimate of one join side's size in bytes, produced at planning time from statistics that may be absent, stale, or derived from file metadata alone.
This article explains what spark.sql.autoBroadcastJoinThreshold actually measures, how to verify which side Spark chose to build and why, how it differs from spark.sql.broadcastTimeout, when restructuring the join beats raising the number, and how adaptive query execution (AQE) changes the decision at runtime. It is written for data engineers debugging a slow or shuffled join. Apache Spark's own configuration reference and performance-tuning guide are the primary sources; scenarios are labelled as illustrative reasoning, not measured benchmarks.
What the threshold actually compares against
The Spark configuration reference defines spark.sql.autoBroadcastJoinThreshold as the maximum size in bytes for a table that will be broadcast to all worker nodes when performing a join, defaulting to 10485760 bytes (10 MB); setting it to -1 disables broadcasting. The comparison is against the optimizer's estimated size of a join side at planning time — not the bytes on disk, and not the row count a human eyeballs.
Documented defaults and fallbacks that shape the planning-time size estimate. Values are configuration defaults in bytes, not measurements of any particular table.
That estimate comes from data-source statistics such as Parquet footer metadata, from catalog statistics collected with ANALYZE TABLE, or from fallbacks when statistics are missing. The fallback behaviour is documented and conditional: spark.sql.statistics.fallBackToHdfs (default false) falls back to HDFS when table statistics are unavailable, but is effective only for non-partitioned Hive tables; for non-partitioned data source tables the size is automatically recalculated when statistics are missing; and for partitioned data source and partitioned Hive tables the estimate becomes spark.sql.defaultSizeInBytes when statistics are unavailable.
So a dimension table that is 2 GB on disk but filtered to a few megabytes by a pushed-down predicate may qualify for broadcast, while a genuinely 5 MB table with no statistics may be estimated at a default that exceeds the threshold. Because the estimate is a planning-time input, stale or absent statistics are the usual reason a small table loses the broadcast test.
Why Spark chose sort-merge join for your "small" dimension table
Sort-merge join is the default outcome when the planner cannot justify a broadcast, and there are several distinct routes to it. The estimated build side may exceed the threshold. Statistics may be missing or stale, making the estimate unreliable in either direction. The join condition may not be eligible for a broadcast hash join — a non-equi condition routes to a broadcast nested loop join instead, which depends on whether an equi-join key exists. A join hint on the other side can override selection: the hints documentation states that when different join strategy hints are specified on both sides, Spark prioritizes BROADCAST over MERGE over SHUFFLE_HASH over SHUFFLE_REPLICATE_NL. Or the threshold was lowered or disabled in the session.
One diagnostic is unusually clean. The same hints page says the join side carrying a BROADCAST hint is broadcast regardless of autoBroadcastJoinThreshold. If the hint produces a broadcast and the automatic path does not, the join's shape is fine and the estimate is the obstacle. This section diagnoses; the fixes follow.
Verifying the build side and the chosen strategy before you touch the threshold
Do not change the threshold until you can state, in bytes, what Spark estimated and what the build side actually materialized. A repeatable procedure gets you there.
Step 1 — read the physical plan. Run EXPLAIN, or EXPLAIN FORMATTED for a plan outline plus node details, or EXPLAIN COST for a logical plan with statistics where available; the EXPLAIN reference documents each mode. Look for BroadcastHashJoin, SortMergeJoin or ShuffledHashJoin, and identify which input is the build side.
Step 2 — inspect the statistics on plan nodes. The Databricks cost-based optimizer documentation shows EXPLAIN output carrying Statistics(sizeInBytes=..., rowCount=..., hints=none) per node, and notes that a missing rowCount means there is not enough information to calculate it because some required columns lack statistics.
Step 3 — cross-check against runtime reality. The same page describes the Spark SQL UI's estimated-versus-actual lines: rows output: 2,451,005 est: N/A means no statistics were available; est: 1616404 (1X) means the estimate was close; a large error factor means the estimate was badly wrong.
Step 4 — confirm the build side's actual bytes from the stage's shuffle read or broadcast exchange metrics rather than trusting the plan alone.
The threshold is not the timeout: broadcastTimeout and how broadcast failures present
These two settings answer different questions. spark.sql.autoBroadcastJoinThreshold is a planning decision about whether to broadcast. spark.sql.broadcastTimeout, default 300 seconds per the configuration reference, is the timeout for the broadcast wait time in broadcast joins — how long a task waits to collect the broadcast, not whether the broadcast is chosen.
The failure signatures differ too. A timeout typically surfaces as a task failure referencing the broadcast wait, often when the broadcast is large or executors are slow to fetch it. A memory failure from an oversized broadcast presents far less specifically: the Azure Databricks memory-issues guidance lists "a large broadcast" among common causes and shows the generic ExecutorLostFailure ... Remote RPC client disassociated pattern, while warning that such errors are often generic and other issues can cause them. Confirm a broadcast OOM — by checking broadcast exchange sizes and testing with more memory per core — rather than assuming it.
There is also a separate hard ceiling: spark.sql.maxBroadcastTableSize defaults to 8589934592 bytes (8 GB) and caps the table size that can be broadcast at all, so raising the auto threshold past it will not help. Raising the threshold to fix a timeout is a category error; raising it to fix a memory failure makes the memory failure worse.
When to restructure the join instead of raising the threshold
Raising the threshold is appropriate only when the build side is genuinely small, stable, and the estimate is the sole obstacle — and even then, fixing statistics is the cheaper first move. Restructuring wins when the size is real.
Restructure when the build side only appears small because a filter could be applied earlier: push the predicate down so the estimate shrinks before the join. Restructure when the "dimension" is actually a large fact-like table that belongs on the probe side. Restructure when the join is skewed, where AQE's skew handling (spark.sql.adaptive.skewJoin.enabled, default true) is the relevant lever. And restructure when the same join repeats across many queries and a bucketed or storage-partitioned layout could eliminate the shuffle entirely; the performance-tuning guide describes storage-partition join for V2 sources, where compatible partitioning lets Spark drop the exchange from both sides of the plan.
Illustrative scenario A: filtered dimension. A 2 GB dimension table is joined after a date filter that reduces it to a few megabytes. The estimate may still reflect the unfiltered scan if the predicate is applied above the join input. Pushing the filter into the scan lowers the estimate and can restore the broadcast without touching configuration. This is a reasoning example, not a measured benchmark.
Illustrative scenario B: genuinely large build side. A table that looks like a dimension is in fact hundreds of megabytes after filtering. Raising the threshold here converts a shuffle into a broadcast that every executor must hold in memory. The better move is to keep the shuffle and address skew or layout.
The judgment rule: change the threshold when the estimate is wrong; change the query or the layout when the size is real.
How AQE changes the decision at runtime — and whether you need both thresholds
spark.sql.adaptive.enabled defaults to true, and when it is on, Spark re-optimizes the query plan mid-execution using runtime statistics. The performance-tuning guide states that AQE converts a sort-merge join to a broadcast hash join when the runtime statistics of any join side are smaller than the adaptive broadcast hash join threshold. That is less efficient than planning the broadcast up front, but better than continuing the sort-merge join: it avoids sorting both sides and can read shuffle files locally to save network traffic, provided spark.sql.adaptive.localShuffleReader.enabled is true (default true).
On the "both thresholds" question, the configuration reference is explicit. spark.sql.adaptive.autoBroadcastJoinThreshold (since 3.2.0) has no independent default: its default is the same as spark.sql.autoBroadcastJoinThreshold, and it is used only in the adaptive framework. Setting the classic threshold alone therefore also moves the AQE threshold unless you override it; setting only the AQE one leaves planning-time behaviour unchanged.
The practical consequence: with AQE on, a join that planned as sort-merge can still become a broadcast at runtime, so a plan that looks wrong in EXPLAIN may resolve itself. Verify in the SQL UI's executed plan before concluding the threshold is the problem. And because AQE's runtime broadcast carries the same memory risk, the adaptive threshold deserves the same scrutiny.
Common misconceptions
"The threshold compares to the table's size on disk." It compares to an estimate, which may come from file metadata, catalog statistics, or a default when statistics are absent.
"A small row count means a small broadcast." The estimate is in bytes. Wide rows, unpruned columns, or missing statistics change the outcome regardless of row count.
"Raising the threshold always speeds up the join." It can convert a shuffle into a broadcast that then exhausts executor memory, and the Azure Databricks guidance explicitly lists large broadcasts among common memory-issue causes.
"broadcastTimeout controls whether a broadcast happens." It controls the wait, not the choice.
"AQE makes the static threshold irrelevant." AQE uses its own threshold, which defaults to the static one, so the static value still shapes both planning and the adaptive fallback.
A practical acceptance checklist
Run these checks before and after any change:
EXPLAIN FORMATTEDshows the intended join operator, and the build side is the side you expect.Plan-node statistics show a
rowCountandsizeInBytesyou can defend, or you have documented why they are missing.The Spark SQL UI's estimated-versus-actual rows are within an error factor you accept.
The broadcast exchange size sits comfortably below executor memory headroom, not merely below the threshold.
If AQE is enabled, the executed plan matches the planned intent.
The change is scoped to the session or query where it is justified, not applied cluster-wide by default.
FAQ
Does setting the threshold to -1 disable broadcasting entirely? Per the configuration reference, yes — for both spark.sql.autoBroadcastJoinThreshold and spark.sql.adaptive.autoBroadcastJoinThreshold.
What is the default value and unit? 10485760 bytes, i.e. 10 MB.
Does a BROADCAST hint override the threshold? Yes. The hints documentation says the hinted side is broadcast regardless of autoBroadcastJoinThreshold.
Why does EXPLAIN show sort-merge but the query still runs fast? AQE may convert it to a broadcast hash join at runtime. Check the SQL UI's executed plan before treating the plan as the problem.
Is spark.sql.maxBroadcastTableSize the same as the threshold? No. It is a separate hard ceiling on the table size in bytes that can be broadcast, defaulting to 8589934592 bytes (8 GB).
Where this fits in a broader tuning strategy
The threshold is one planning input among several: statistics quality, join hints, AQE, skew handling, and physical layout such as bucketing and storage-partitioned joins. The highest-leverage fix is usually making the estimate trustworthy — collecting and refreshing statistics, pushing predicates down, keeping column statistics current — rather than moving the number. The Databricks CBO guidance makes the same point from the optimizer side: missing or inaccurate statistics are a common cause of a slower-than-expected multi-join query.
If you are evaluating a lakehouse engine that plans joins differently from open-source Spark, treat plan transparency as a criterion: does the engine expose per-node statistics and let you verify which side it built? That is a question you can test in a proof of concept, not a claim to accept from a vendor page.
Before you change any configuration, run EXPLAIN FORMATTED on the join that is bothering you and write down the estimated size of each side — that single number usually tells you whether you have a statistics problem or a data-shape problem.