
SQL & BI Tricks to Deep-Dive User Behavior Without Data-Science Overhead
Master SQL & BI Tricks to analyze user behavior, uncover insights, and drive decisions—all without the need for advanced data science expertise.
Analyzing user behavior doesn’t have to be complicated. SQL and BI tools allow you to uncover insights without needing advanced data science skills. These tools help you identify patterns and trends in your user data quickly and effectively. By using SQL & BI Tricks, you can make informed decisions that drive growth and improve user engagement. This approach ensures that even non-technical teams can access valuable insights with ease.
Key Takeaways
SQL and BI tools help teams study data easily. Anyone can find useful information without needing special skills.
No-code BI tools save money compared to old data science methods. They cut costs on programs and equipment.
Real-time BI dashboards show user actions right away. This helps teams change plans quickly for better results.
Tricks like subqueries and window functions group users and find patterns. This leads to smarter ads and better user interest.
Automated reports keep track of user actions all the time. Teams can react fast to changes and make smarter choices.
Benefits of SQL & BI Tricks for User Behavior Analysis
Accessibility for Non-Technical Teams
SQL & BI Tricks empower non-technical teams to analyze data without needing advanced skills. Many modern BI tools are designed with accessibility in mind. For example:
BI Tool | Accessibility Features |
|---|---|
Holistics | Enables business users to ask queries without SQL. |
Metabase | Allows non-tech users to ask no-SQL queries. |
Ajelix | Self-service BI platform that doesn’t require technical knowledge. |
Power BI Alternatives | Easy setup and no learning curve for non-tech users. |
These tools democratize access to data insights. You can ask questions and get answers from data without writing a single line of SQL. This makes it easier for teams across departments to make data-driven decisions.
Cost-Effectiveness Compared to Data Science Solutions
Using SQL & BI Tricks is more cost-effective than traditional data science approaches. No-code BI tools reduce upfront expenses by offering subscription-based models. They also minimize setup costs by leveraging cloud solutions instead of requiring expensive hardware.
Total Cost of Ownership (TCO): Traditional BI systems incur high licensing and maintenance costs, while no-code BI tools automate updates and reduce IT support needs.
Initial Setup Costs: Cloud-based BI tools eliminate the need for significant investments in software and hardware.
Maintenance Costs: Automated updates and reduced IT dependency lower long-term expenses.
By adopting these tools, you can save money while still gaining valuable insights into user behavior.
Real-Time Insights with BI Dashboards
BI dashboards provide real-time insights into user behavior, helping you track performance and detect anomalies. These dashboards continuously update from multiple sources, ensuring you always have the latest data.
Metric | Description |
|---|---|
Lead Conversion Rates | Measures the percentage of leads that convert into customers |
Customer Lifetime Value | Estimates the total revenue a business can expect from a customer over the duration of their relationship |
Sales Team Performance | Evaluates the effectiveness and productivity of the sales team |
Revenue Forecasts | Predicts future revenue based on historical data and trends |
With live insights, you can monitor key metrics like lead conversion rates and customer lifetime value. This allows you to make timely adjustments to your strategies and improve outcomes.
SQL & BI Tricks for Behavioral Insights
Using Subqueries to Segment User Groups
Subqueries are a powerful way to segment your users based on specific criteria. By embedding one query inside another, you can filter and analyze data more effectively. For example, you might want to identify users who made a purchase in the last 30 days but haven’t logged in during the past week. A subquery can help you isolate this group quickly.
Here’s a simple example:
SELECT user_id, name
  FROM users
  WHERE user_id IN (
      SELECT user_id
      FROM purchases
      WHERE purchase_date >= CURRENT_DATE - INTERVAL '30 days'
  )
  AND user_id NOT IN (
      SELECT user_id
      FROM logins
      WHERE login_date >= CURRENT_DATE - INTERVAL '7 days'
  );
This query identifies users who meet both conditions. Subqueries allow you to create highly targeted segments, which can be used for personalized marketing campaigns or retention strategies.
In practice, businesses have used subqueries to solve real-world problems. For instance:
Case Study | Problem | SQL Solution | Impact |
|---|---|---|---|
Customer Churn Analysis | Identify users likely to cancel | Calculate user engagement metrics | |
Sales Funnel Drop-Off | Track users abandoning carts | Analyze purchase funnel progress | Improved conversion rates |
These examples show how subqueries can uncover actionable insights, helping you address specific challenges effectively.
Leveraging Window Functions for Trend Analysis
Window functions are another essential tool in your SQL toolkit. They allow you to perform calculations across a set of rows related to the current row, making them ideal for trend analysis. For example, you can calculate running totals, rank users by activity, or compare current performance to historical averages.
Here’s how you can use a window function to calculate a running total of purchases:
SELECT user_id, purchase_date, amount,
         SUM(amount) OVER (PARTITION BY user_id ORDER BY purchase_date) AS running_total
  FROM purchases;
This query calculates a running total for each user, helping you identify spending patterns over time. Window functions are particularly useful for tracking trends like user engagement or revenue growth.
Consider these real-world applications:
Case Study | Problem | SQL Solution | Impact |
|---|---|---|---|
Marketing Campaign Performance | Evaluate ROI by channel | Analyze purchase behavior by source | Boosted ROI by 12% |
Product Performance by Region | Compare sales across regions | Aggregate sales by region | Optimized stock levels |
By leveraging window functions, you can gain deeper insights into user behavior and make data-driven decisions to improve outcomes.
Creating Common Table Expressions (CTEs) for Simplified Queries
Common Table Expressions (CTEs) simplify complex queries by breaking them into smaller, more manageable parts. They improve readability and make it easier to debug and reuse your SQL code.
Here’s an example of a CTE:
WITH recent_purchases AS (
      SELECT user_id, SUM(amount) AS total_spent
      FROM purchases
      WHERE purchase_date >= CURRENT_DATE - INTERVAL '30 days'
      GROUP BY user_id
  )
  SELECT u.user_id, u.name, rp.total_spent
  FROM users u
  JOIN recent_purchases rp ON u.user_id = rp.user_id
  WHERE rp.total_spent > 100;
This query identifies users who spent more than $100 in the last 30 days. The CTE (recent_purchases) isolates the logic for calculating total spending, making the main query easier to read and maintain.
CTEs offer several advantages over traditional nested queries:
Feature | CTEs | Traditional Nested Queries |
|---|---|---|
Readability | Low - can be convoluted | |
Reusability | High - allows for reuse of subqueries | Low - requires rewriting |
Debugging | Easier - isolates parts of the query | Harder - intertwined logic |
Performance Optimization | Variable - not always optimized | Often better for large datasets |
By using CTEs, you can write cleaner, more efficient SQL queries. This approach saves time and reduces errors, especially when working with large datasets.
Optimizing SQL Queries for Better Performance
Indexing for Faster Query Execution
Indexes are like a book's table of contents—they help you locate information quickly without flipping through every page. In SQL, indexing speeds up query execution by allowing the database to find data without scanning the entire table. For example, adding an index to frequently queried columns can reduce execution time significantly.
A benchmark showed that indexing on the
idandgcolumns reduced query execution time to just 6.379 ms, highlighting its impact on performance.
Indexes also improve user satisfaction by delivering faster response times. To create an index, you can use a simple SQL command:
CREATE INDEX idx_user_id ON users(user_id);
This small change can make a big difference in how quickly your queries run.
Avoiding Overly Complex Joins
Complex joins often slow down queries and make them harder to debug. Simplifying joins improves performance and ensures accurate data retrieval. For instance, redundant joins can be avoided by carefully analyzing your query's structure. Tools like EXPLAIN ANALYZE help identify inefficiencies in your joins.
Overly complex joins can:
Strain database performance.
Lead to inaccuracies in results.
Increase query execution time.
By optimizing joins and using indexing, you can reduce the number of records scanned and speed up lookups. This approach ensures your queries remain efficient and reliable.
Aggregating Data Efficiently
Data aggregation is essential for summarizing large datasets. Efficient aggregation techniques save time and resources. For example, e-commerce platforms like Amazon aggregate sales data to recommend products, boosting customer loyalty and sales.
Industry | Example | Efficiency Demonstrated |
|---|---|---|
Financial Services | Banks analyze transaction data to study spending trends. | Improved customer satisfaction and security. |
Healthcare | Clinics aggregate patient data for research. | Advanced medical research and better patient outcomes. |
Using SQL functions like SUM, AVG, and GROUP BY simplifies aggregation. Here's an example:
SELECT category, SUM(sales) AS total_sales
  FROM products
  GROUP BY category;
This query calculates total sales for each product category, helping you identify top-performing items.
SQL & BI Tricks like these ensure your queries run efficiently, saving time and improving decision-making.
Visualizing User Behavior with BI Dashboards
Building Interactive Dashboards for Engagement Metrics
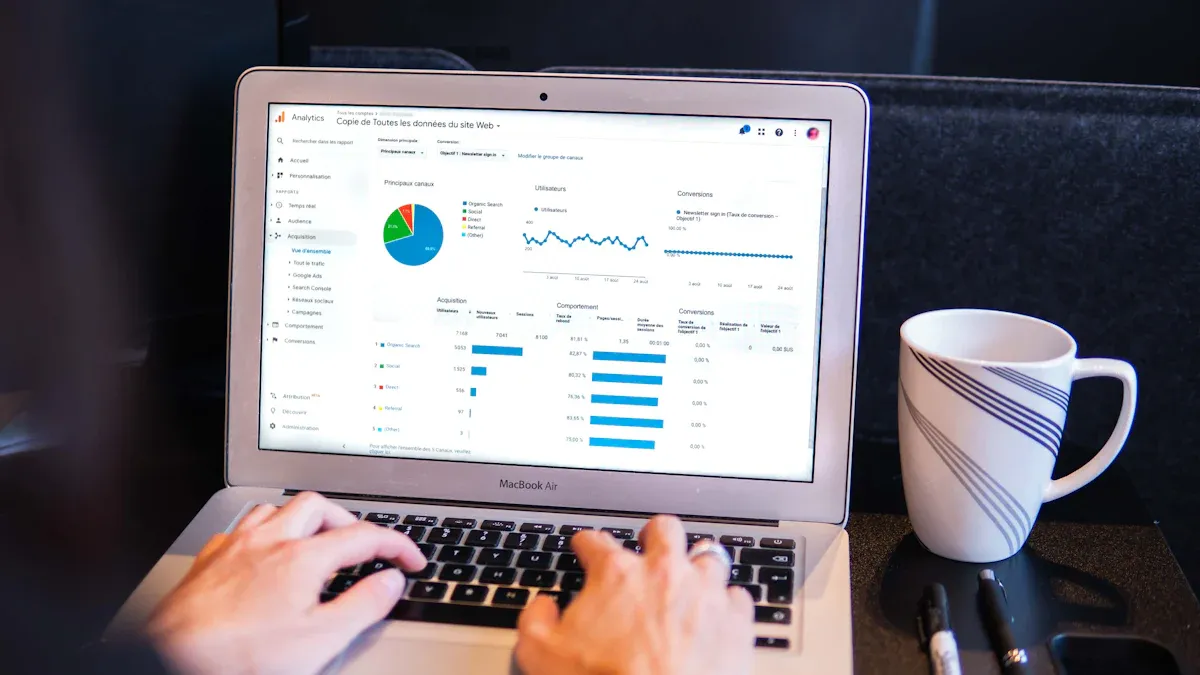
Interactive dashboards transform raw data into actionable insights. By presenting metrics visually, you can quickly identify trends and anomalies in user behavior. These dashboards improve engagement by allowing users to interact with the data directly.
For example, metrics like usage frequency analysis and navigation flow mapping help you understand how users interact with your platform. A well-designed dashboard highlights high-impact elements and pinpoints bottlenecks in navigation. Here’s a breakdown of key metrics that benefit from interactive designs:
Metric | Description |
|---|---|
Usage Frequency Analysis | Identifies frequently used or ignored components to focus on high-impact elements. |
Navigation Flow Mapping | Visualizes user paths to pinpoint bottlenecks or unnecessary steps in navigation. |
Time-on-Component Measurement | Measures engagement by tracking how long users spend on specific charts or data sections. |
Filter and Drill-Down Adoption | Monitors the popularity of filters and drill-downs to prioritize critical segmentation options. |
User Feedback Synthesis | Combines qualitative feedback with quantitative data to reveal user pain points and requests. |
Interactive dashboards also boost user engagement. Metrics like clicks, viewings, and session durations reflect how users interact with the dashboard. When users spend more time exploring data, they uncover deeper insights.
Metric | Description |
|---|---|
Clicks | The number of times users interact with the dashboard, indicating interest and engagement. |
Viewings | The total number of times the dashboard is accessed, reflecting overall user engagement levels. |
Sessions | The duration of user interactions with the dashboard, showing sustained engagement over time. |
By leveraging interactive designs, you can create dashboards that not only inform but also engage users effectively.
Using Filters and Drill-Downs for Granular Insights
Filters and drill-downs are essential tools for uncovering granular insights. They allow you to narrow down data and focus on specific segments. For instance, you can click on a chart’s data point to view detailed records related to that metric. Filters like date ranges or job postings help you refine your analysis further.
Here are some practical examples of how filters and drill-downs enhance data exploration:
Users can click on a data point in a chart to access a detailed table of records related to that metric.
Applying filters, such as date range and job postings, allows users to narrow down the data they are analyzing.
Filtering for the previous month reveals discrepancies in posting closures, highlighting the importance of drill-downs for understanding data nuances.
These features make it easier to identify trends, anomalies, and opportunities within your data. By using filters and drill-downs, you can focus on the most relevant information and make informed decisions.
Automating Reports for Continuous Monitoring
Automated reports simplify the process of monitoring user behavior over time. Instead of manually generating reports, you can set up automated systems to deliver insights regularly. This ensures you always have up-to-date information to guide your strategies.
Automation has proven effective in several areas:
Identifying at-risk customers and implementing retention strategies.
Optimizing onboarding processes based on successful user journeys.
Prioritizing feature development based on actual usage patterns.
Improving customer support by predicting and addressing common issues.
For example, automated reports can track login frequency to identify users at risk of churn. They can also analyze feature adoption rates to prioritize development efforts. By automating these processes, you save time and ensure consistent monitoring of critical metrics.
Automated reports not only streamline workflows but also enhance decision-making. With continuous monitoring, you can respond to changes in user behavior promptly and effectively.
Practical Applications of SQL & BI Tricks
Identifying Churn Risk Through Login Frequency Analysis
Tracking login frequency is a simple yet effective way to identify users at risk of churn. A noticeable drop in logins often signals disengagement. For example, users who log in less frequently or spend shorter durations on your platform may be losing interest. You can use SQL queries to monitor these patterns and flag at-risk users.
Here’s a sample query to identify users with declining activity:
SELECT user_id, COUNT(*) AS login_count
  FROM logins
  WHERE login_date >= CURRENT_DATE - INTERVAL '30 days'
  GROUP BY user_id
  HAVING COUNT(*) < 5;
This query highlights users with fewer than five logins in the past month. Metrics like session duration and participation in events can further refine your analysis. For instance, a drop in admin engagement while regular users remain active might indicate dissatisfaction among decision-makers. By acting on these insights, you can implement targeted retention strategies, such as personalized outreach or exclusive offers.
Tracking Feature Adoption with Event Data
Event data provides valuable insights into how users interact with your platform. By tracking feature adoption, you can identify which features drive engagement and which need improvement. Segmenting users by cohorts helps you analyze adoption rates and understand user preferences.
For example, you can use SQL to track activation goals with feature tags:
SELECT feature_name, COUNT(*) AS activations
  FROM feature_usage
  WHERE activation_date >= CURRENT_DATE - INTERVAL '30 days'
  GROUP BY feature_name;
This query reveals the most and least adopted features. Combining this data with heatmaps or in-app surveys can help you prioritize feature development. Case studies show that tracking event data has led to significant improvements, such as a 75% increase in CV uploads for one platform. These insights enable you to enhance user satisfaction and boost engagement.
Analyzing Purchase Patterns to Optimize Upselling Strategies
Understanding purchase patterns is key to crafting effective upselling strategies. SQL allows you to analyze customer behavior, such as purchase history, page views, and email engagement. For instance, you can identify regular buyers and introduce premium products tailored to their preferences.
Here’s a query to analyze purchase frequency:
SELECT user_id, COUNT(*) AS purchase_count, AVG(order_value) AS avg_order_value
  FROM purchases
  GROUP BY user_id;
This query helps you segment customers based on their buying habits. For example, new members might respond well to starter bundles, while premium members could be offered exclusive services. Metrics like average order value and upsell conversion rates provide measurable outcomes, ensuring your strategies are both effective and data-driven.
SQL and BI tools empower you to analyze user behavior without requiring advanced expertise. Techniques like subqueries, window functions, and dashboards simplify data exploration and uncover actionable insights. Companies like Netflix, Amazon, and e-commerce platforms demonstrate the impact of these tools:
Company | BI Tool Usage Description | Outcome |
|---|---|---|
Netflix | Uses data analytics to understand viewing habits and preferences. | Increases user satisfaction and retention through tailored recommendations. |
E-commerce | Implements BI tools to visualize user interactions and identify pain points. | Enables identification of opportunities for improvement in user experience. |
Amazon | Tracks user behavior to optimize product listings and inventory management. | Predicts high-demand products and ensures they are well-stocked, enhancing sales efficiency. |
By applying SQL & BI Tricks, you can enhance your understanding of user behavior and make data-informed decisions that drive growth.
FAQ
What makes SQL and BI tools better than traditional data science methods?
SQL and BI tools simplify data analysis. You don’t need advanced coding skills or expensive software. These tools provide quick, actionable insights through queries and dashboards, making them accessible for teams of all skill levels.
Can I use SQL & BI tricks without technical expertise?
Yes! Many BI platforms offer no-code solutions. You can create dashboards, apply filters, and analyze data without writing SQL. These tools are designed for non-technical users, making data exploration easy and intuitive.
How do BI dashboards help in understanding user behavior?
BI dashboards visualize data in real-time. They highlight trends, anomalies, and key metrics like engagement rates. Interactive features like filters and drill-downs allow you to explore granular insights, helping you make informed decisions quickly.
Are SQL queries difficult to optimize for performance?
Not at all. Simple techniques like indexing, avoiding complex joins, and efficient aggregation improve query speed. With practice, you’ll learn to write optimized queries that handle large datasets effectively.
Can SQL & BI tricks work for small businesses?
Absolutely! SQL and BI tools are cost-effective and scalable. Small businesses can use them to track user behavior, identify trends, and make data-driven decisions without investing in expensive data science solutions.
See Also
Transforming Data Obstacles Into Opportunities: Atlas and Singdata
Techniques and Challenges in Short-Term Demand Forecasting
Effective Weekly Strategies for Retail Demand Forecasting
The Shift from Automation to Smart Supply Chain Intelligence