
High-performance, Cost-efficient AI Data Platforms: A Workload-Based Architecture and Total Cost Evaluation Framework
A workload-based architecture and TCO framework for evaluating AI data platforms: inventory, cost model, unit metrics, and acceptance checklist.

The buying decision for a high-performance, cost-efficient AI data platform has moved from "which engine is fastest" to "which architecture fits which workload at what defensible cost." Unit economics, as the FinOps Foundation defines it, brings technology spend and the value that spending creates into one view, and that is the frame this guide uses throughout.
Most enterprise teams make the platform decision before the workload inventory exists, and they build the budget case on list price. That order produces commitments signed against an unvalidated model, migration costs that surface late, and a warehouse-level bill mistaken for a cost model.
This guide delivers four artifacts you can use directly: a workload inventory, an architecture-to-workload map, a total cost of ownership model, and an acceptance checklist for the signing meeting.
One disclosure before the frameworks. This guide is published by a data platform vendor. Every vendor-published figure in it, including the publisher's own, is a vendor-reported claim to validate in your own environment. No customer name or performance multiple is asserted here as established fact.
What Makes an AI Data Platform High-Performance and Cost-Efficient
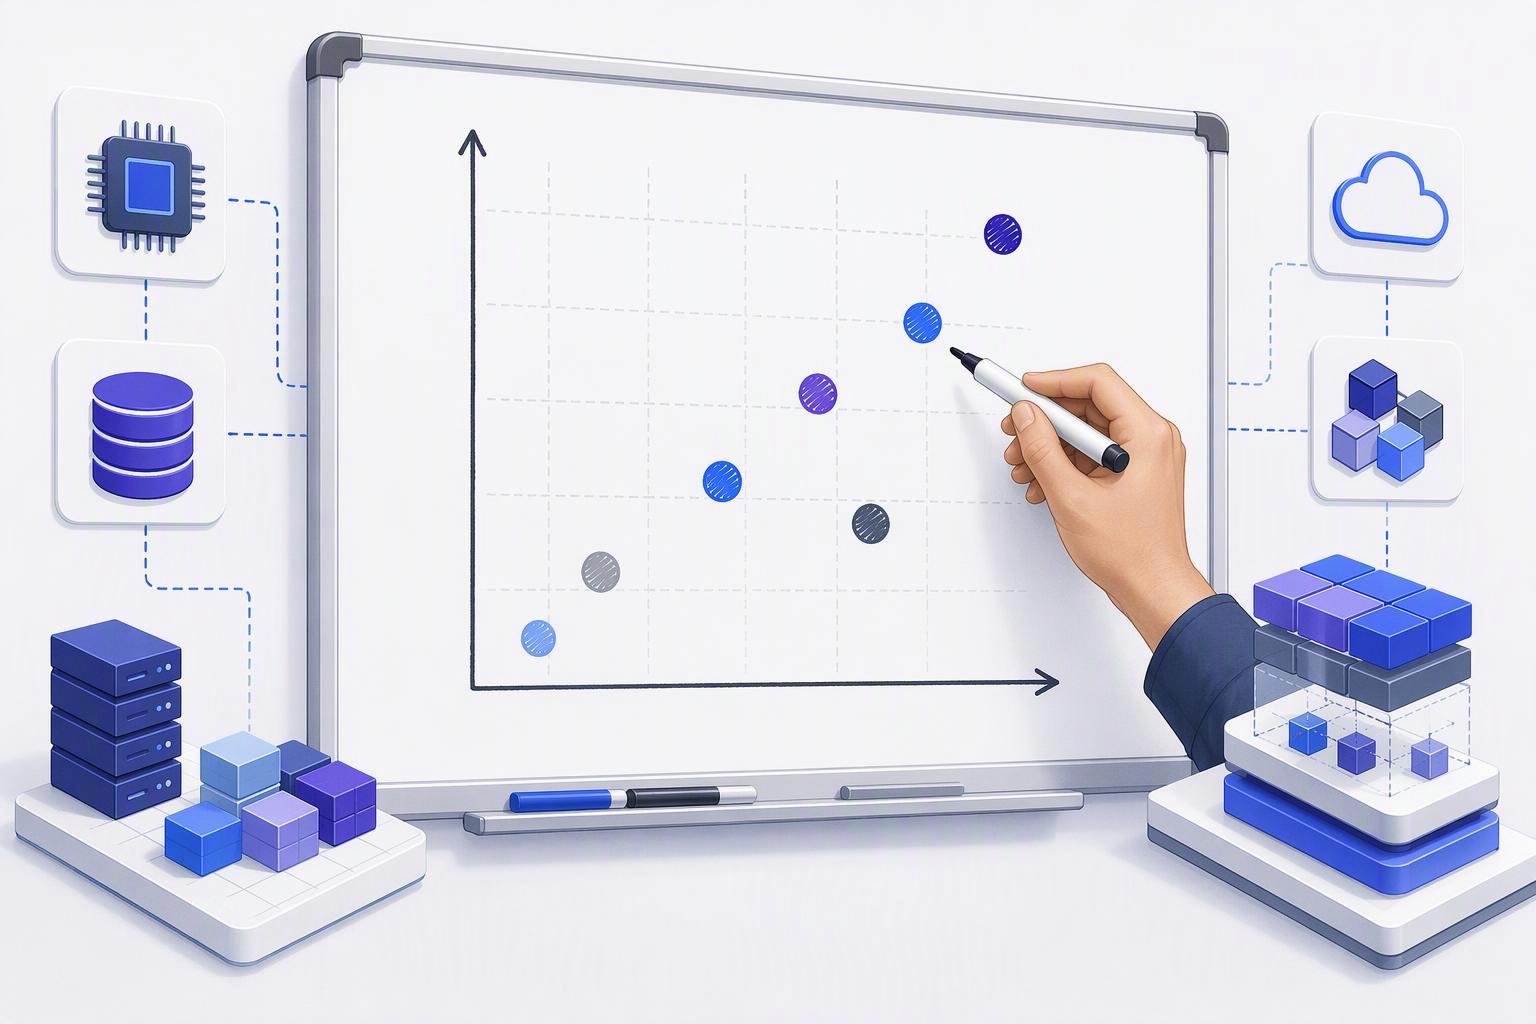
High-performance and cost-efficient are two axes, not one benchmark number and one price. The FinOps Foundation separates unit metrics into resource-efficiency metrics, such as cost per GB stored, cost per GB transferred, cost per vCPU and cost per token, and business metrics, such as cost per tenant, cost per transaction, cost to serve, cost per case resolved and cost per workload (FinOps Foundation, current framework page). A platform that wins on the first axis and loses on the second is not cost-efficient; it is fast and expensive.
The framework's Data Value Density KPI makes the trade-off measurable: business value divided by data platform TCO, where a ratio approaching or falling below 1.0 signals a value leak in which maintenance cost exceeds benefit (FinOps Foundation, 2025-05-14). That ratio is the single number a platform decision should move.
Cost-efficiency also has a definition that excludes the invoice. The same framework defines TCO for a data cloud platform as the full cost of a data product, domain or workload, not the provider invoice alone, and requires six component groups in any model: consumption-based compute, storage and retention, data transfer and egress, enabling platform services, licensing and support, and AI/ML costs (FinOps Foundation, 2025-05-14). These are the AI data platform evaluation criteria this guide builds on.
Key Takeaway Treat every vendor-published performance and cost figure, including the publisher's, as a vendor-reported claim to validate in your own environment before it enters a business case.
How Do We Classify Our Real Workloads Before We Compare Platforms
The workload inventory comes first, and it is a workload-based architecture for AI data platforms that starts with classification rather than a shortlist. The FinOps Foundation names consumption volatility and concurrency and scheduling behaviour as distinct cost components, and it names shared pool attribution as a required step, because pooled warehouses and clusters hide which workload drove a change (FinOps Foundation, 2025-05-14).
Concurrency and scheduling behaviour have a price mechanism you can measure. Snowflake's own documentation of warehouse credit consumption states that credits are charged by number of warehouses, run duration and size, that each size increase roughly doubles computing power and credits billed per full hour, and that credits are billed per second with a 60-second minimum, so every resume, resize or suspend-and-resume inside the first minute restarts the minimum and creates multiple charges (Snowflake, current page). A workload with bursty concurrency is therefore a different cost object from a steady one, even at identical data volume.
Inventory field | What to record | Illustrative row (illustrative only) |
|---|---|---|
Workload name and owning team | Accountable team and product owner | Finance close reporting, FP&A platform team |
Data volume and daily increment | Total stored, daily delta | 240 TB stored, 1.8 TB/day |
Peak-to-average ratio | Peak concurrency divided by average | 9:1 |
Freshness requirement | How stale the data may be | 15 minutes |
Latency target at the query | Acceptable response time | Under 3 seconds at p95 |
Concurrency at peak | Simultaneous users or jobs | 140 |
RPO/RTO | Recovery objectives | RPO 15 min, RTO 1 hour |
Retention period | Hot, warm and archive horizons | 13 months hot, 7 years archive |
Workload type | Batch, streaming, interactive, AI/ML | Interactive plus scheduled batch |
The point of the table is to stop a "BI dashboard" that is really a minute-level freshness requirement with bursty concurrency from sitting in the same column as a T+1 report. Classifying the two correctly is also what makes choosing between real-time and batch without surprising the bill a decision you can defend rather than a preference.
Which Architecture Choices Map to Which Workload Classes
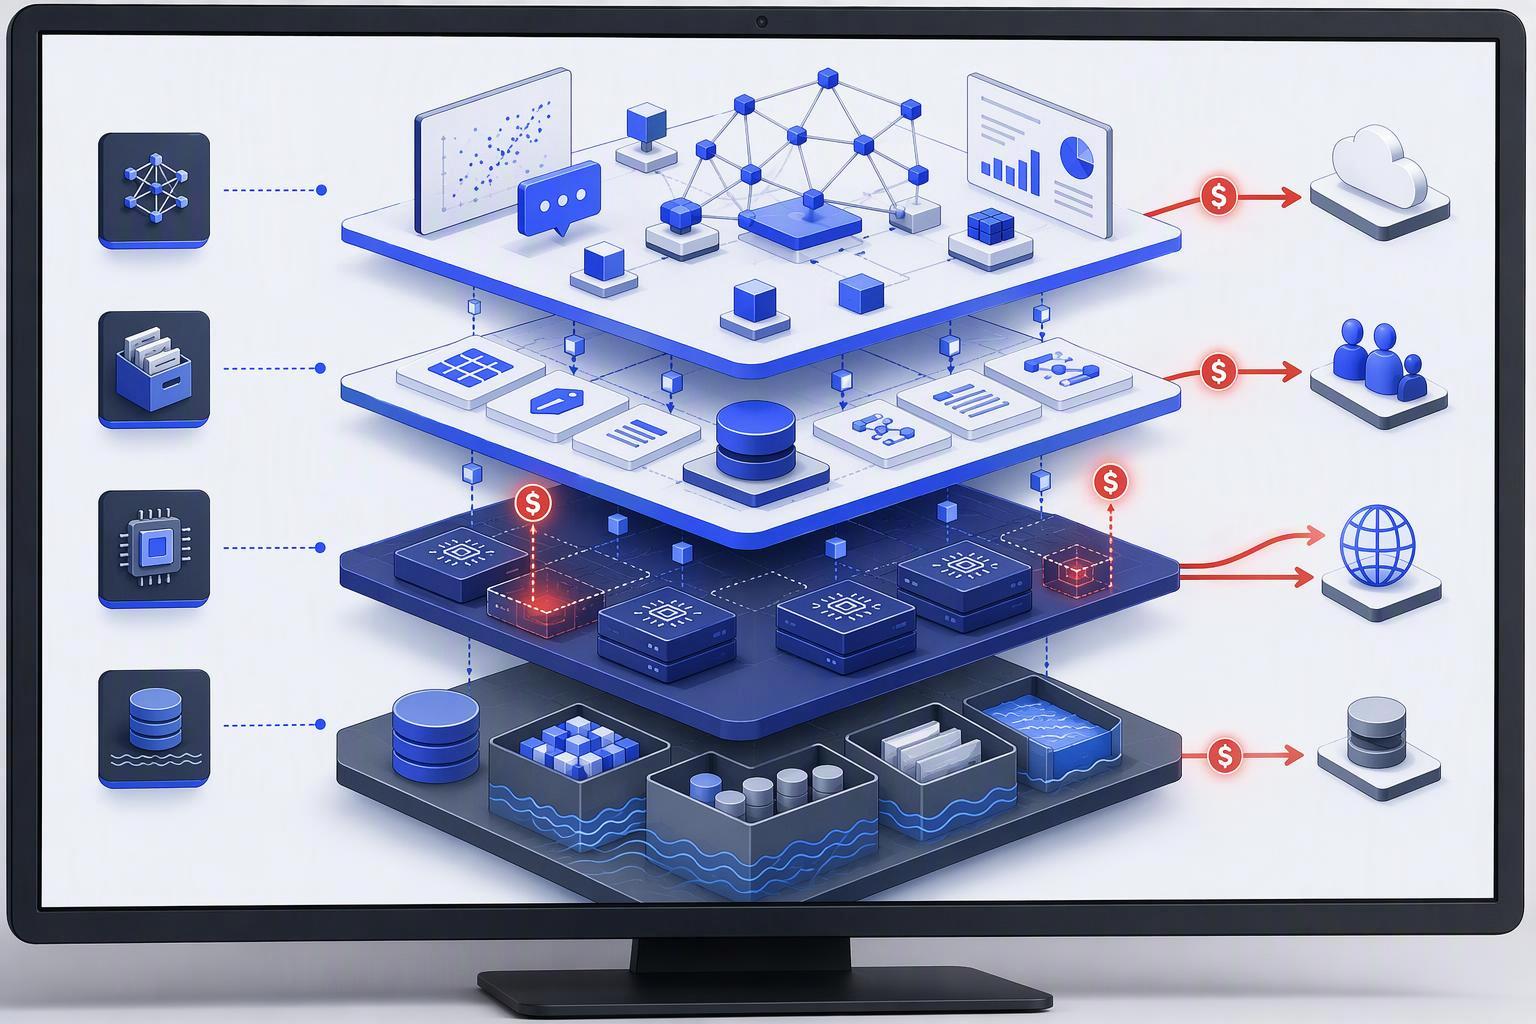
Architecture follows the inventory, and the mapping is a cost decision before it is a technology decision. Microsoft's cost optimization design principles require a cost model as a prerequisite to financial tracking, state that the model must estimate and forecast total cost of ownership including infrastructure, support and implementation, and require cost to be attributed across business units with showback and chargeback (Microsoft, current page). That is the attribution principle behind every cell in the matrix below, and it is what turns a workload-based architecture for AI data platforms into a defensible budget line rather than an engineering preference.
Workload class | Batch ETL | Streaming | Interactive analytics | AI/ML training and serving |
|---|---|---|---|---|
High-volume nightly transformation | Strong fit | Poor fit | Workable | Poor fit |
Sub-minute event processing | Poor fit | Strong fit | Poor fit | Poor fit |
Ad hoc analyst queries | Workable | Poor fit | Strong fit | Poor fit |
Model training on large history | Strong fit | Poor fit | Poor fit | Strong fit |
Mixed freshness and latency | Workable | Workable | Workable | Workable |
The matrix is a reasoning aid, not a vendor ranking. Its most important row is the last one: a workload that needs throughput, freshness and low latency together is where single-purpose engines force a second system, and where consolidation decisions get made.
One vendor's positioning describes its answer as incremental compute, processing only what changed rather than re-scanning the estate, and presents that mechanism as covering throughput, freshness and latency with flexible trade-offs. Treat it as the vendor's own terminology for its own mechanism, not an industry-standard category, and test the claim against your own workload mix.
Consolidation is not automatically cheaper. Migration cost and blast radius are incurred at the boundaries between storage, compute, catalog and semantic layers, and they are easy to discover late. Put them in the model before you sign anything.
What Belongs in a Total Cost of Ownership Model for a Data Platform
A total cost of ownership model for data platforms is a six-group structure, and the invoice is one input among many. The FinOps Foundation's data cloud platform framework requires consumption-based compute (credits, DBUs, slots), storage and retention, data transfer and egress, enabling platform services such as orchestration, catalog, lineage and governance, licensing and support, and AI/ML costs covering training, fine-tuning, serving, data movement and maintenance (FinOps Foundation, 2025-05-14).
Component group | Line items | Who supplies the number |
|---|---|---|
Consumption-based compute | Credits, DBUs or slots; idle time; autoscaling behaviour | Vendor usage export |
Storage and retention | Hot, warm, archive tiers; replication copies | Provider pricing page |
Data transfer and egress | Cross-region, cross-cloud, internet egress, sharing | Provider pricing page |
Enabling platform services | Orchestration, catalog, lineage, governance tooling | Vendor and internal tooling inventory |
Licensing and support | Existing agreements, support tier, training | Procurement and internal finance |
AI/ML | Ingestion and preparation, training, model storage, inference, monitoring | Internal estimate plus provider rates |
Microsoft's guidance on building a cost model adds the time dimension: the model must include operational costs and maintenance and support, and it should cover initial implementation, steady-state run rate and ongoing lifecycle cost across periods with growth scenarios, while AI requires separating data ingestion and preparation, training or fine-tuning, model storage, inference, and monitoring and operations rather than treating AI compute as one line (Microsoft, 2023-11-15).
Egress deserves its own treatment because it is the line teams most often omit. AWS cost-optimization guidance on data transfer states that charges are determined by the source, destination and volume of traffic, requires teams to model the services that transfer data and to model cost over different usage levels, and notes that transfer fees are usually neglected because of on-premises design habits (AWS, current page). AWS pricing documentation confirms the mechanism: outbound internet transfer is metered by source, destination and region, with a 100 GB per month allowance and additional charges for external and cross-region transfers (AWS, current page).
Exit cost is now a dated line rather than a negotiation. The European Commission's explanation of the Data Act states that during the transition from 11 January 2024 to 12 January 2027 providers may charge only the costs incurred for switching and data egress, and that from 12 January 2027 switching and data egress charges are removed entirely (European Commission, current page). The binding text is Regulation (EU) 2023/2854, published in the Official Journal on 22 December 2023 (EUR-Lex, 2023-12-22).
⚠️ Warning The model is a modelling method, not a forecast. It depends on your measured unit costs. Microsoft's and AWS's frameworks require labour to be modelled but publish no share of TCO, so you must supply your own number and state its basis. reducing data platform TCO by simplifying the stack
Which Unit Metrics Make the Cost Case Defensible to Finance
Unit metrics turn a platform bill into a defensible cost case, and the FinOps Foundation's vocabulary gives you two families to present. Resource-efficiency metrics cover cost per GB stored, cost per GB transferred, cost per vCPU and cost per token; business metrics cover cost per tenant, cost per transaction, cost to serve, cost per case resolved and cost per workload (FinOps Foundation, current framework page). Note what the framework does not name: cost per query appears as a platform measure in the data cloud profile rather than as a named unit metric, so present it as efficiency context, not as headline unit economics.
The reason a warehouse-level view fails in front of finance is structural. FinOps states that warehouse or cluster level views "show a component of spend but rarely explain it," that in shared multi-tenant warehouses the high-level view lacks the execution context to explain a change, and that shared warehouse spend only becomes actionable when attributed to the queries and jobs that actually ran (FinOps Foundation, 2026-02-12). A monthly total cannot answer whether the increase came from a runaway query, an uncontrolled dashboard refresh or an orchestration loop.
The inputs for these metrics come from billing telemetry rather than invoices. Snowflake's per-second billing with a 60-second minimum on every start, resume and resize is exactly the consumption volatility the FinOps profile flags, and it is invisible in a monthly warehouse total (Snowflake, current page). Transfer charges follow the same logic: AWS states that source, destination and volume determine them (AWS, current page).
To make the cost per workload data platform TCO case, divide the attributed spend for a workload by its completed units, and keep the denominator stable across periods so the trend means something.
Why Do Vendor Benchmarks and Per-TB List Prices Mislead
Vendor benchmarks and per-TB list prices mislead because the published number and the decision number are produced under different conditions. Muehleisen's study of the documented pitfalls in database benchmarking describes "benchmarketing" by vendors comparing their own systems, deliberate and inadvertent configuration differences, compilation flags and configuration parameters that change results by orders of magnitude, and tuning towards a specific benchmark. One cited case shows transaction throughput varying by a factor of 28 with a single parameter setting, and none of 16 surveyed papers reported the parameters needed to interpret their results (Muehleisen, DBTest 2018).
The problem is not confined to vendor marketing. A systematic review of 117 DBMS performance studies found that performance is usually tested in a way that does not reflect real-world use cases and reported in insufficient detail for replication, that an empirical study without reproducible evidence should be considered the authors' opinion rather than an empirical study, and that among the 19% of studies using defined benchmark suites, database structure and DBMS parameters were almost universally not reported (2023). That finding covers DBMS performance benchmarking, not cloud cost benchmarking, so do not transfer its percentages to cost studies.
A benchmark's own caveats can be the most useful thing about it. ClickBench's own list of limitations states that it tests neither concurrent queries nor system capacity, that every query runs only a few times, that its dataset is a single flat table which disadvantages classical star and snowflake warehouses, and that its 99,997,497 records are "rather small by modern standards." Read that list against your own inventory: if your workload is concurrent and your schema is a star, the benchmark did not test your case.
Benchmark design itself now points at cost. The TPC-DS specification, the industry-standard decision-support benchmark, is at V4, whose Dynamic Pricing Model replaces the static price/performance metric with total cost of ownership modelling, adds the term Pricing Period Cost covering all hardware, software, licensed computing services and maintenance updates used during the designated pricing period, and states that V4 results are not comparable with any previous version. Never place a V3 result beside a V4 result, and treat the pricing period as part of the result rather than a footnote.
Apply the same test to any benchmark you are shown, and to how TB-scale analytics platforms compare tool by tool when a vendor publishes one. The reproducibility checklist below is the fastest way to run those AI data platform evaluation criteria against a number before it reaches your TCO model.
Check | Pass | Fail | Not reported |
|---|---|---|---|
Benchmark version stated | |||
Dataset and subset named | |||
Hardware described | |||
DBMS parameters disclosed | |||
Database structure disclosed | |||
Concurrency and capacity tested | |||
Repetitions stated | |||
Cost basis defined |
What Acceptance Checklist Should We Run Before Signing
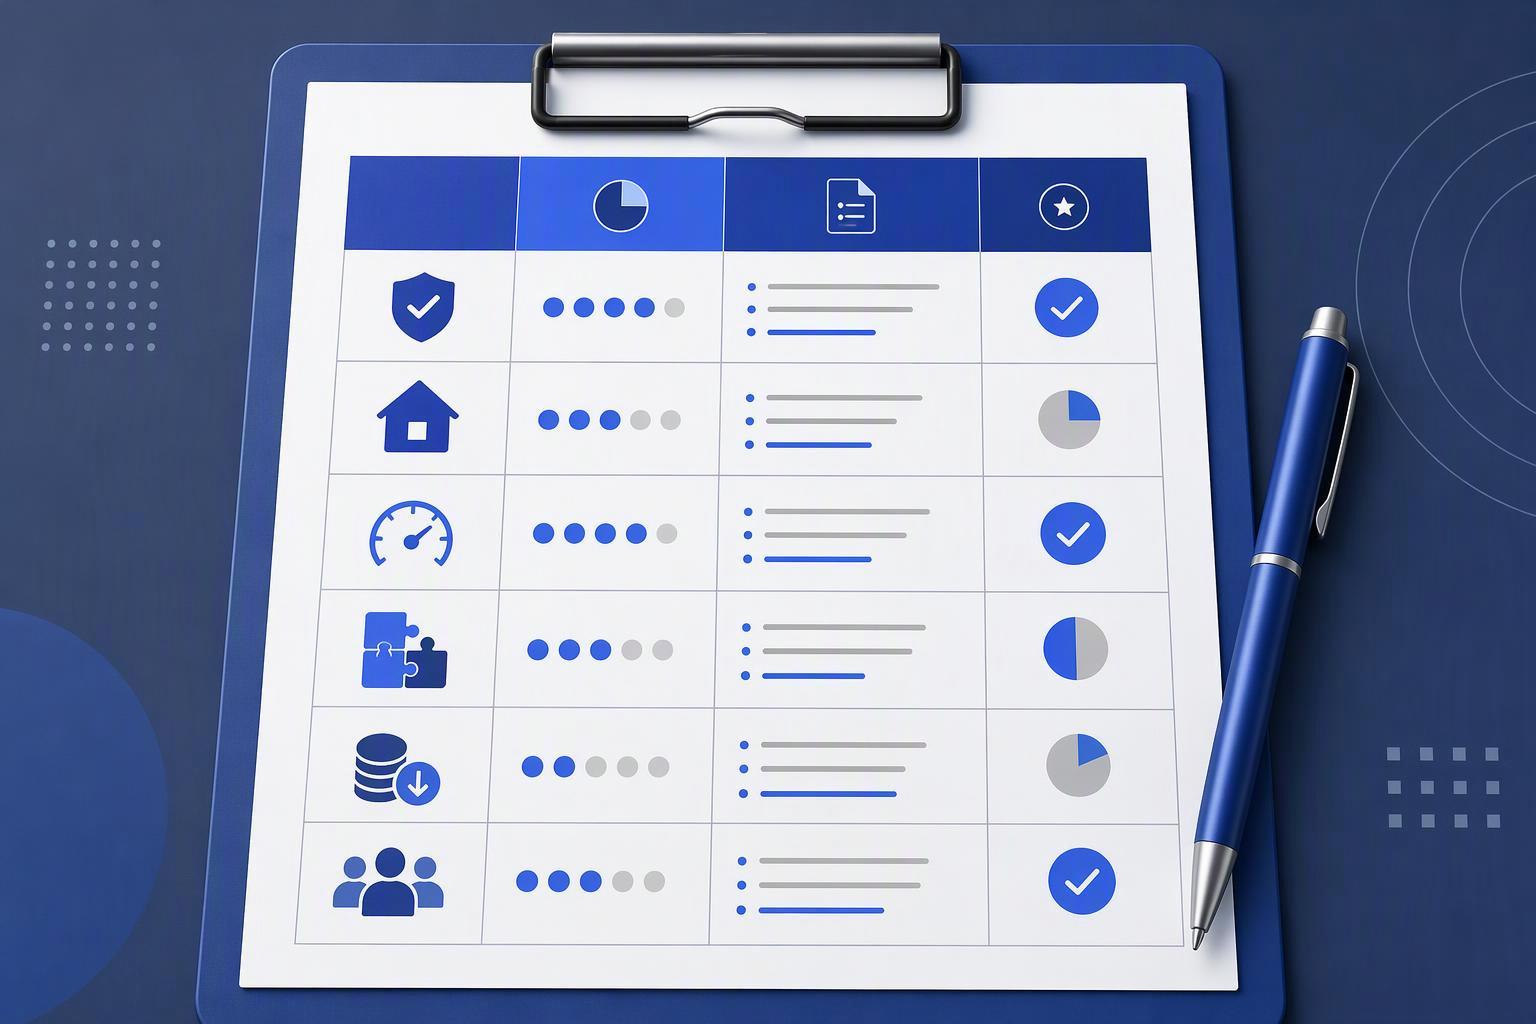
The acceptance checklist converts the framework into evidence you demand before signature, and every row requires a document rather than an assurance. Microsoft's guidance is explicit that the cost model is an estimate and the budget is a reality, and it instructs teams to create a second cost model that fits a reduced budget with a buffer (Microsoft, 2023-11-15). The FinOps profile separately warns that commitment-based contracts carry rollover terms and use-it-or-lose-it constraints (FinOps Foundation, 2025-05-14). A commitment purchased against an unvalidated model converts an estimate-versus-budget gap into a contractual loss.
Criterion | Weight | Evidence required | Score (0-5) |
|---|---|---|---|
Workload coverage | High | Vendor test conditions for each of your workload classes | |
Benchmark reproducibility | High | Version, dataset, hardware, DBMS parameters, DB structure, concurrency, repetitions | |
Cost model completeness | High | All six component groups populated with your unit costs | |
Egress and exit terms | High | Per-GB rates by region, plus switching terms against the 12 January 2027 date | |
Unit metric reporting | Medium | Cost per workload and cost per GB transferred available from telemetry | |
SLA, RPO/RTO | High | Contractual targets with remedies | |
Residency and compliance | High | Data location guarantees and audit rights | |
Integration surface | Medium | Catalog, orchestration and identity integration evidence | |
Migration and exit plan | Medium | Code change estimate and tested export path | |
Commitment flexibility | Medium | Rollover terms and overage treatment in writing |
Score each row against evidence, not against a demonstration. The reproducibility row is where most vendor material fails: apply the same disclosure standard the systematic review found missing in most published studies, and ask for the parameters that let a third party reproduce the result (systematic literature review, 2023). If a vendor will not supply them, record the row as not reported and price the risk.
What Does the Evidence Actually Support About Singdata's Positioning
The evidence supports a narrower claim than any vendor's marketing implies, and the honest answer is that most of it is vendor-reported. Singdata's positioning is a single engine for batch, streaming and analytics on one dataset, with incremental compute as the mechanism and multi-cloud plus open formats as the lock-in answer. Its published performance figures, including comparisons against Spark, ClickHouse and Snowflake, come from its own documents with stated test conditions of TPC-DS 10TB, TPC-H 100GB and SSB-FLAT 100GB, and those documents do not state hardware, concurrency or repetition counts.
The customer figures carry the same label. Named cases report performance improvements and cost reductions, and in at least one case the same customer's cost reduction appears as 35% in one document and 65% in another. That disagreement is not a reason to discard the case; it is a reason to treat every vendor-reported customer figure as a range to validate rather than a number to quote.
What the evidence does support is the framework itself. The six TCO component groups, the two unit-metric families, the reproducibility checklist and the regulatory dates are all independently sourced, and they apply to every vendor in the evaluation, including this one. The defensible position is to run the same acceptance checklist against every candidate and let the scored rows decide.
Frequently Asked Questions
What is a workload-based architecture for AI data platforms?
It is an architecture chosen from a classified workload inventory rather than from a benchmark ranking. You record each workload's data volume, peak-to-average ratio, freshness requirement, query latency target, peak concurrency, RPO/RTO and retention period, then map those classes to architecture choices. The FinOps Foundation names concurrency and scheduling behaviour and consumption volatility as distinct cost components, which is why they belong in the inventory (FinOps Foundation, 2025-05-14).
What should a total cost of ownership model for data platforms include?
Six component groups: consumption-based compute, storage and retention, data transfer and egress, enabling platform services, licensing and support, and AI/ML costs. The FinOps Foundation defines TCO as the full cost of a data product, domain or workload rather than the provider invoice alone (FinOps Foundation, 2025-05-14). Microsoft's guidance adds initial implementation, steady-state run rate and lifecycle cost with growth scenarios (Microsoft, 2023-11-15).
Why is a warehouse-level bill not a cost model?
Because it shows a component of spend without explaining it. FinOps states that warehouse or cluster level views rarely explain a change, and that in shared multi-tenant warehouses the high-level view lacks the execution context to identify the cause (FinOps Foundation, 2026-02-12). Attribution to the queries and jobs that actually ran is what makes the spend actionable.
How do we compare vendor benchmarks fairly?
Demand the disclosure that lets a third party reproduce the result: benchmark version, dataset and subset, hardware, DBMS parameters, database structure, whether concurrency and capacity were tested, and repetition counts. Muehleisen documents throughput varying by a factor of 28 with a single parameter setting, and the systematic review found database structure and DBMS parameters almost universally unreported (Muehleisen, DBTest 2018, 2018; systematic literature review, 2023).
Which unit metrics should we present to finance?
Lead with the two families the FinOps Foundation names: resource-efficiency metrics such as cost per GB stored and cost per GB transferred, and business metrics such as cost per tenant, cost per transaction and cost per workload (FinOps Foundation, current framework page). Keep the denominator stable across periods so the trend is interpretable.
How does the EU Data Act change egress and switching costs?
During the transition from 11 January 2024 to 12 January 2027, providers may charge only the costs incurred for switching and data egress; from 12 January 2027 those charges are removed entirely (European Commission, current page). The binding text is Regulation (EU) 2023/2854 (EUR-Lex, 2023-12-22). Treat exit cost as a dated line in the model.
What is the biggest red flag in a platform evaluation?
A commitment contract signed against a cost model that has not been validated against measured usage. Microsoft's guidance states the cost model is an estimate and the budget is a reality, and the FinOps profile warns that commitments carry rollover terms and use-it-or-lose-it constraints (Microsoft, 2023-11-15; FinOps Foundation, 2025-05-14).
Conclusion
The decision has moved from engine speed to architecture fit at a defensible cost, and the evidence supports four artifacts rather than a shortlist. Classify workloads first, using the inventory fields and the concurrency and scheduling behaviour the FinOps Foundation names as cost drivers. Map those classes to architecture choices, and price the data movement that arises at the boundaries between layers. Build the TCO model across the six component groups, with egress and exit cost as dated lines. Then run the scored acceptance checklist and let the evidence rows decide, applying the same reproducibility standard to every vendor, including the one that published this guide.
The next step is a medium-commitment one: take the inventory template and the TCO line-item structure to a solutions consultant and compare deployment options against your own measured unit costs, before any commitment is drafted.